
Descriptive case study, not a recommendation to buy or sell. See the Disclaimer.

Top of the screen · Penny Movers
← Back to the Daily Study for 2026-10-06
Why it is on the list
Landed at the top of today's combined fundamentals-and-trend screen for this group: reported a net profit in its latest fiscal year; price sits above its 200-day average.
Group screen: Price $1–10, market cap $100M–$2B, average volume above 500K shares.
📖 How the screen and the ordering work: Top and Bottom of the Screen: An Ordering, Not a Verdict · The Three Screens: From the Whole Market to Four Names
The session (2026-10-06)

Prices and volume come from the IEX exchange feed (free tier). IEX volume is only the share traded on IEX, a fraction of total US volume, so compare it to its own average rather than to consolidated figures.
| Open | 9.29 |
| Close | 9.23 |
| Change | -0.6% |
| High / Low | 9.36 / 9.18 |
| Day range | 1.9% |
| VWAP | 9.23 (close near VWAP) |
| Volume on IEX | 32K (0.85x its 20-day IEX average of 37K) |
📖 How to read VWAP, range and relative volume: Reading the Session: VWAP, the Day’s Range, and Relative Volume · Where the Numbers Come From: IEX Prices and SEC Filings
Last three months
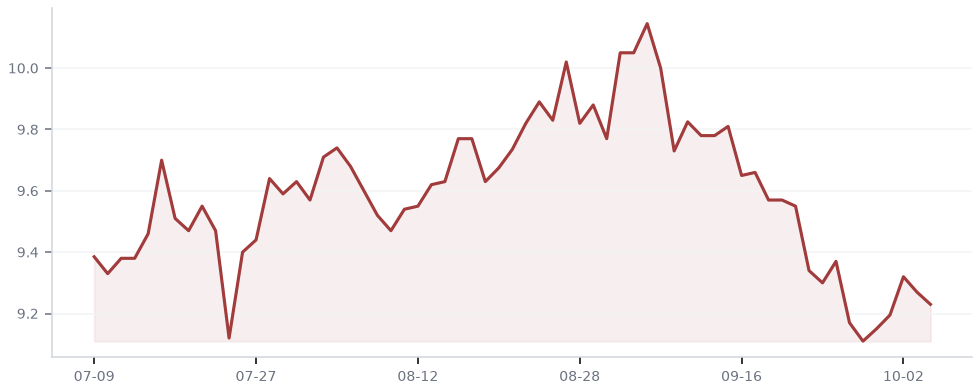
| 3-month change | -1.7% |
| 3-month high / low | 10.23 / 8.77 |
| 52-week high / low | 10.23 / 6.22 |
| Position in 52-week range | 75% (0% = low, 100% = high) |
| 50-day average | 9.63 (price below) |
| 200-day average | 8.50 (price above) |
| 14-day RSI | 39 (0–100 scale of recent up vs. down days) |
📖 How to read moving averages, the 52-week range and RSI: Reading the Trend: Moving Averages, the 52-Week Range, and RSI
Financials (from SEC filings)
| Net income — FY ending 2026-06-30 | $36.3M (prior year $26.1M) |
| Cash — as of 2026-06-30 | $114.8M |
📖 Where these figures come from: Common SEC Filings and What They Tell You · Where the Numbers Come From: IEX Prices and SEC Filings
Figures as reported in the company’s 10-K / 10-Q XBRL data on SEC EDGAR. Some filers use different tags; “n/a” or a missing row means we could not find a consistent value.
Reminder: nothing on this page is investment advice. Past performance does not indicate future results.