
The Three Screens: From the Whole Market to Four Names
Educational content, not investment advice. See our Disclaimer.
What a screen is
A screen is a fixed set of filters applied to every US-listed stock: a price range, a market-cap range, a minimum average daily volume, and sometimes a fundamental condition. It does not judge anything. It simply removes the names that do not fit a definition, so the attention left over can go to the ones that do.
The Daily Study runs three screens every session. The filters do not change from day to day, which is the point: when the same rules are applied every time, the differences you see between two days come from the market, not from someone moving the goalposts.
The three screens
Penny Movers. Price between $1 and $10, market capitalization between $100 million and $2 billion, and average daily volume of at least 500,000 shares. These are small, fast-moving companies; the volume floor removes names that are too thin to trade in any meaningful size.
Swing Setups. Price between $2 and $30, market capitalization between $200 million and $20 billion, and average daily volume of at least 1.5 million shares. This is the middle of the market: liquid enough that multi-day moves are visible on a daily chart, small enough that those moves are still large in percentage terms.
Long-Term Universe. Market capitalization of at least $10 billion, return on equity of at least 15%, and debt-to-equity of at most 1. This screen is about the business rather than the chart: large, profitable companies that are not carrying more debt than equity. (Return on equity and debt-to-equity have their own lesson in the Company Analysis course.)
Why three groups instead of one
A $3 stock with a $300 million market cap and a $2 trillion company do not behave the same way, and mixing them in one list would make every comparison misleading. A 4% day is ordinary for a small-cap and unusual for a mega-cap. Keeping the groups apart means each name is only ever compared against names that move in a similar way. The Large-Cap vs. Small-Cap lesson covers why the tiers behave so differently.
From hundreds of names to four
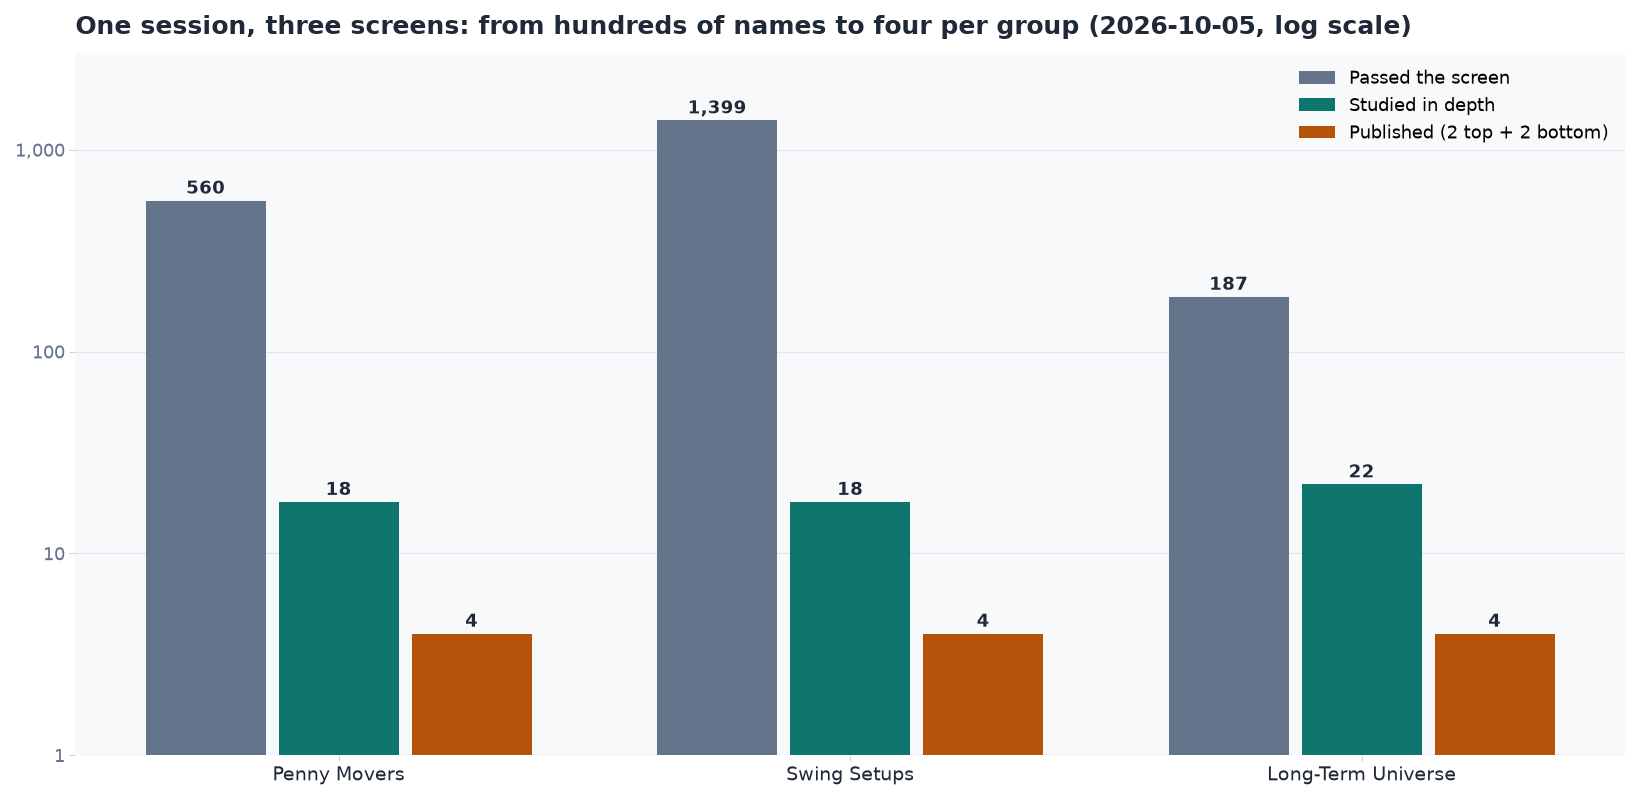
On 2026-10-05, 560 names passed the Penny screen, 1,399 passed the Swing screen and 187 passed the Long-Term screen. Studying more than a thousand stocks in depth every day is not realistic, so a sample is drawn from each screen’s results — 18 names for Penny and Swing, 22 for Long-Term that day — and each of those is studied with the same set of measurements.
From each studied set, four are published: the two at the top of that day’s ordering and the two at the bottom. The next lesson covers what that ordering is and, just as important, what it is not.
What passing a screen does not mean
Passing a screen only means a stock fits a definition on that day. It says nothing about whether the price will rise or fall, and it is not a shortlist of anything to buy. A screen is where looking starts, not where a conclusion is reached.