
Reading the Daily Study
Five lessons on how the Daily Study is built and how to read it — the three screens, what top and bottom of the screen mean, where every number comes from, and how to read a session and a trend using real case studies from the site. It assumes the basics from Technical Analysis and Company Analysis, and links back to them instead of repeating them.
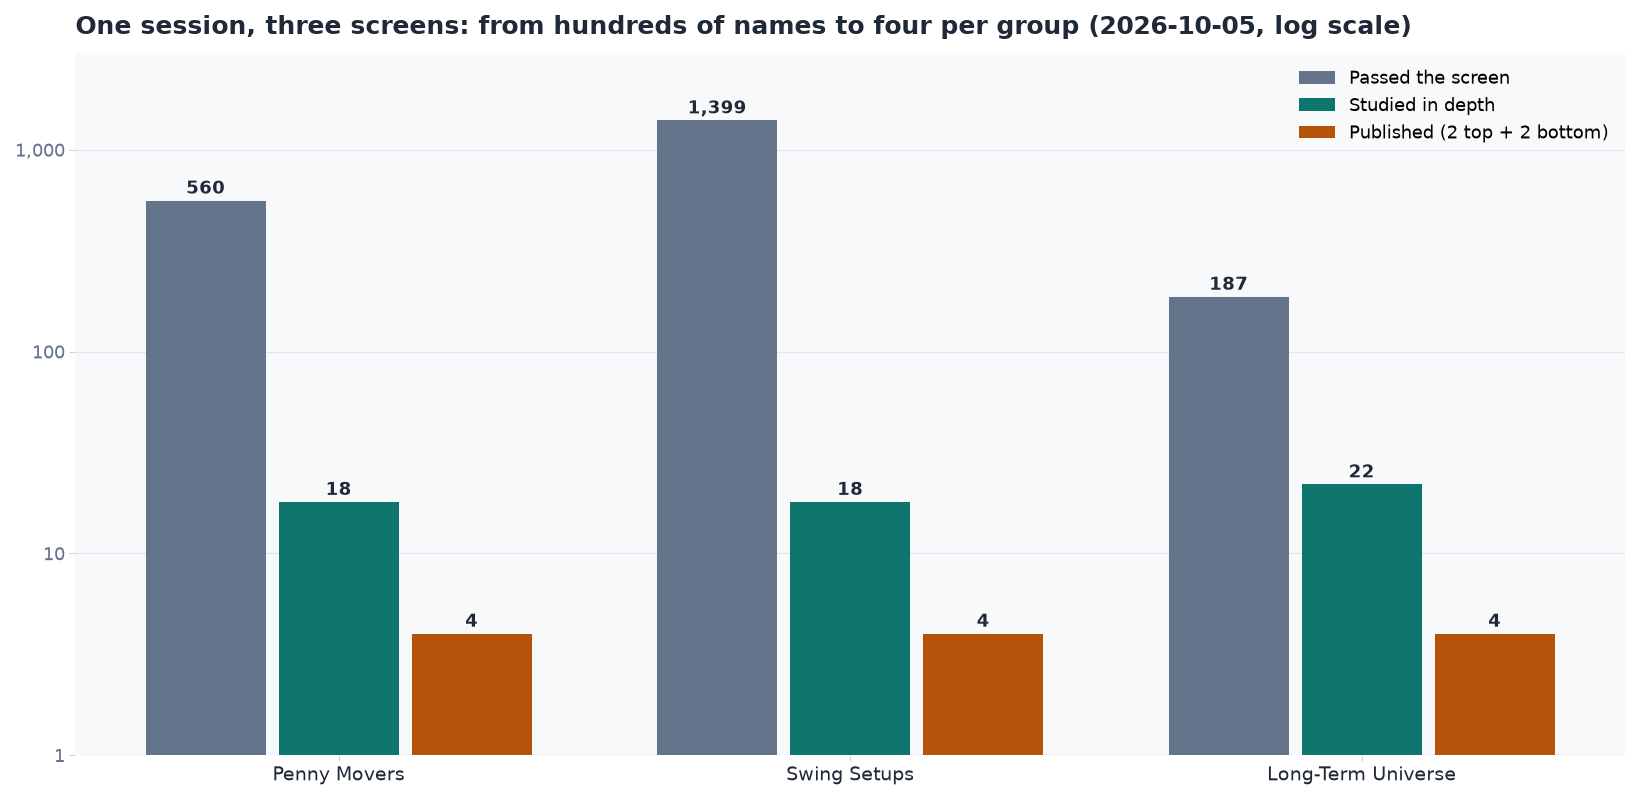
The Three Screens: From the Whole Market to Four Names
Every Daily Study starts from three fixed screens — Penny Movers, Swing Setups and the Long-Term Universe. What each one filters for, why they are kept apart, and how hundreds of names become four per group.
Start the lesson →
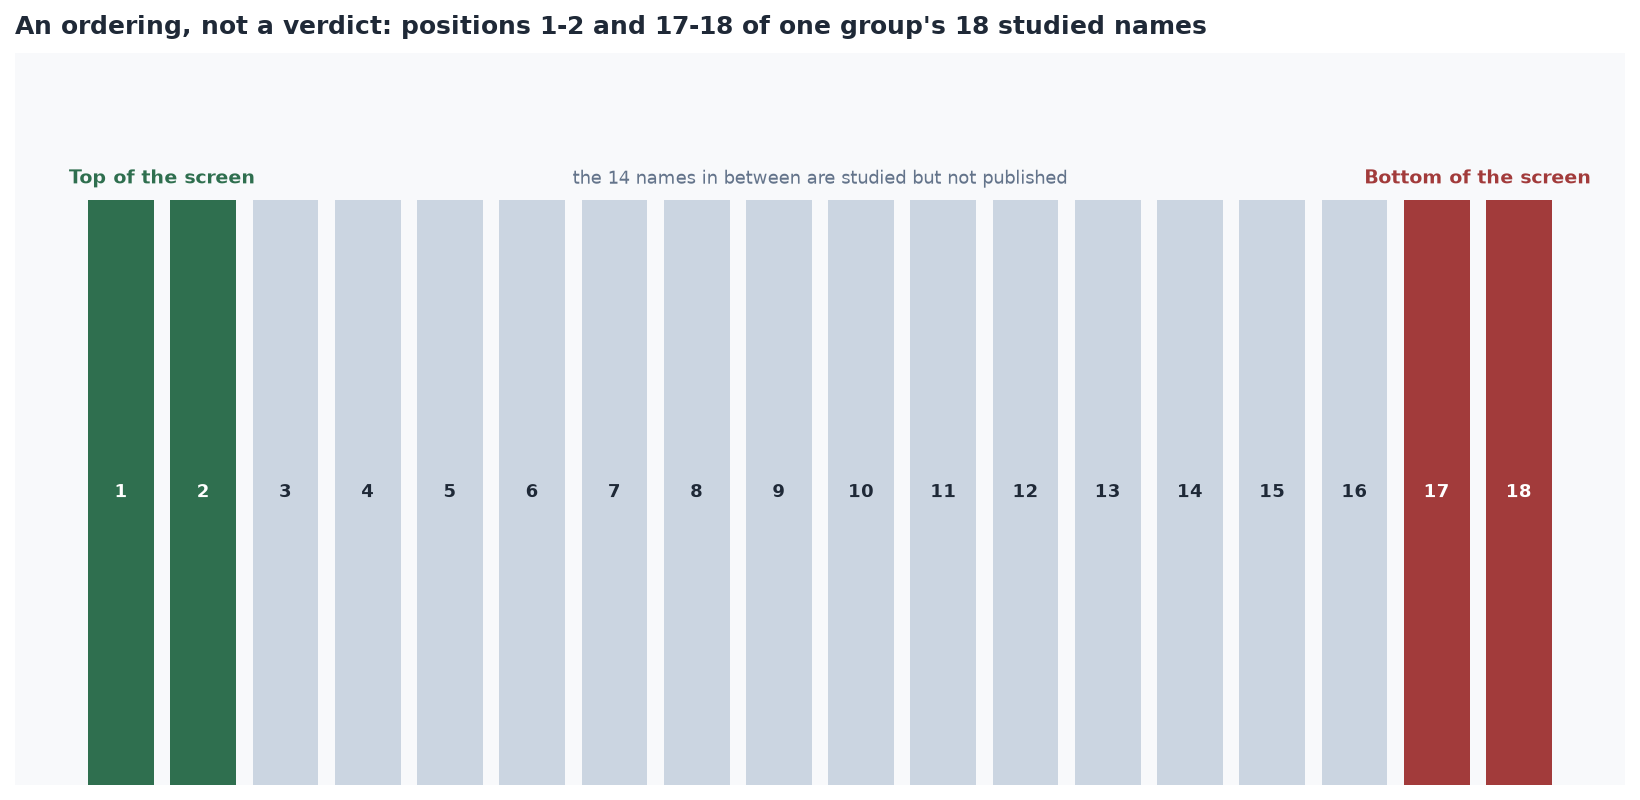
Top and Bottom of the Screen: An Ordering, Not a Verdict
Each group shows two names from the top of that day’s ordering and two from the bottom. How the ordering is built, why the score itself is never published, and the most common ways the labels get misread.
Start the lesson →
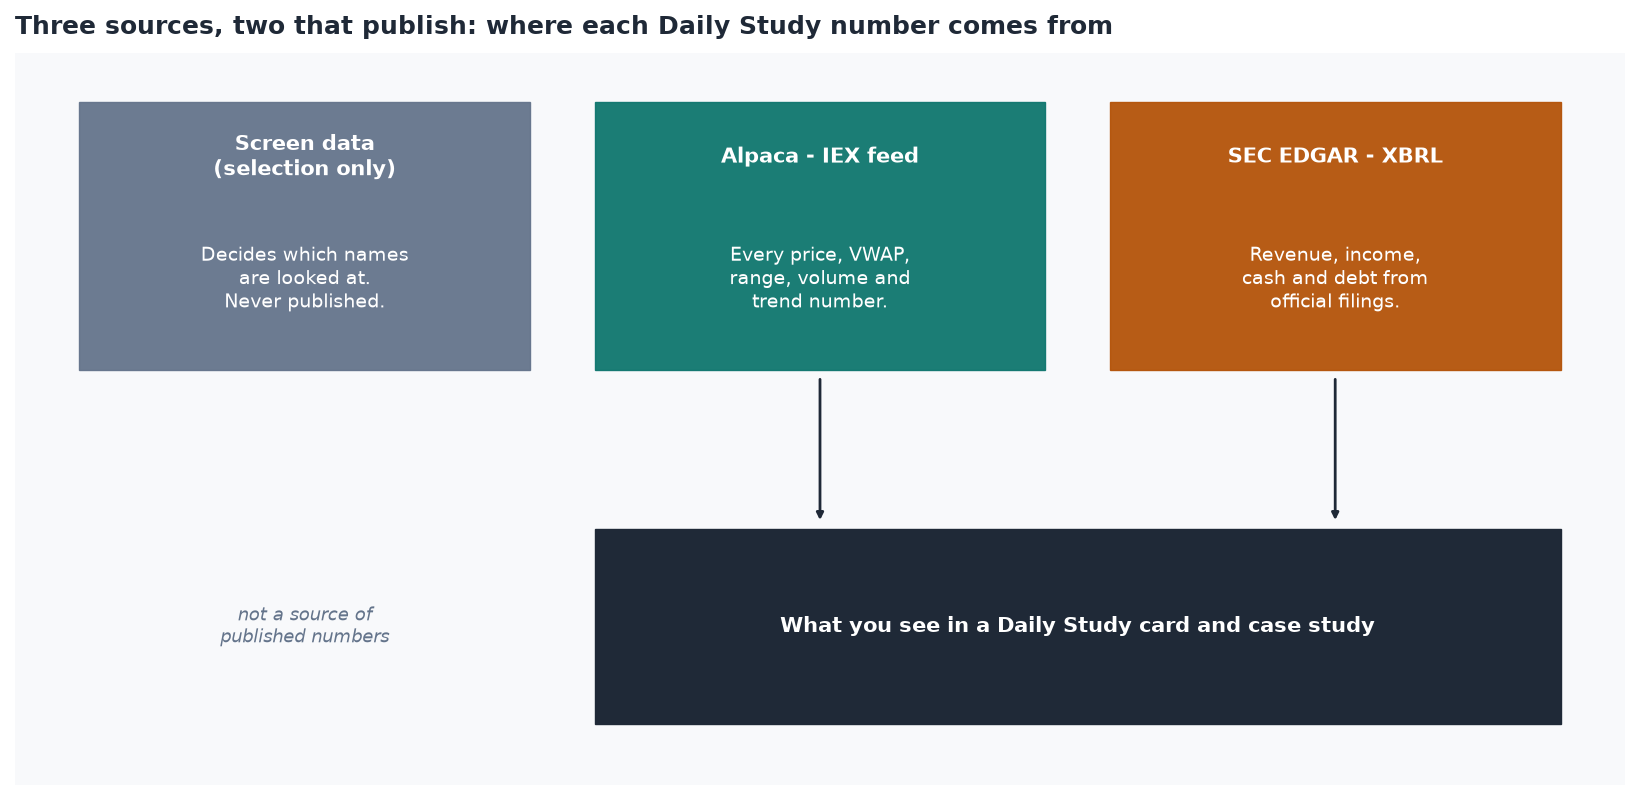
Where the Numbers Come From: IEX Prices and SEC Filings
Three sources feed the Daily Study, and only two of them ever reach the page. What the IEX feed is and why its volume looks small, how SEC XBRL data works, and what is deliberately never published.
Start the lesson →
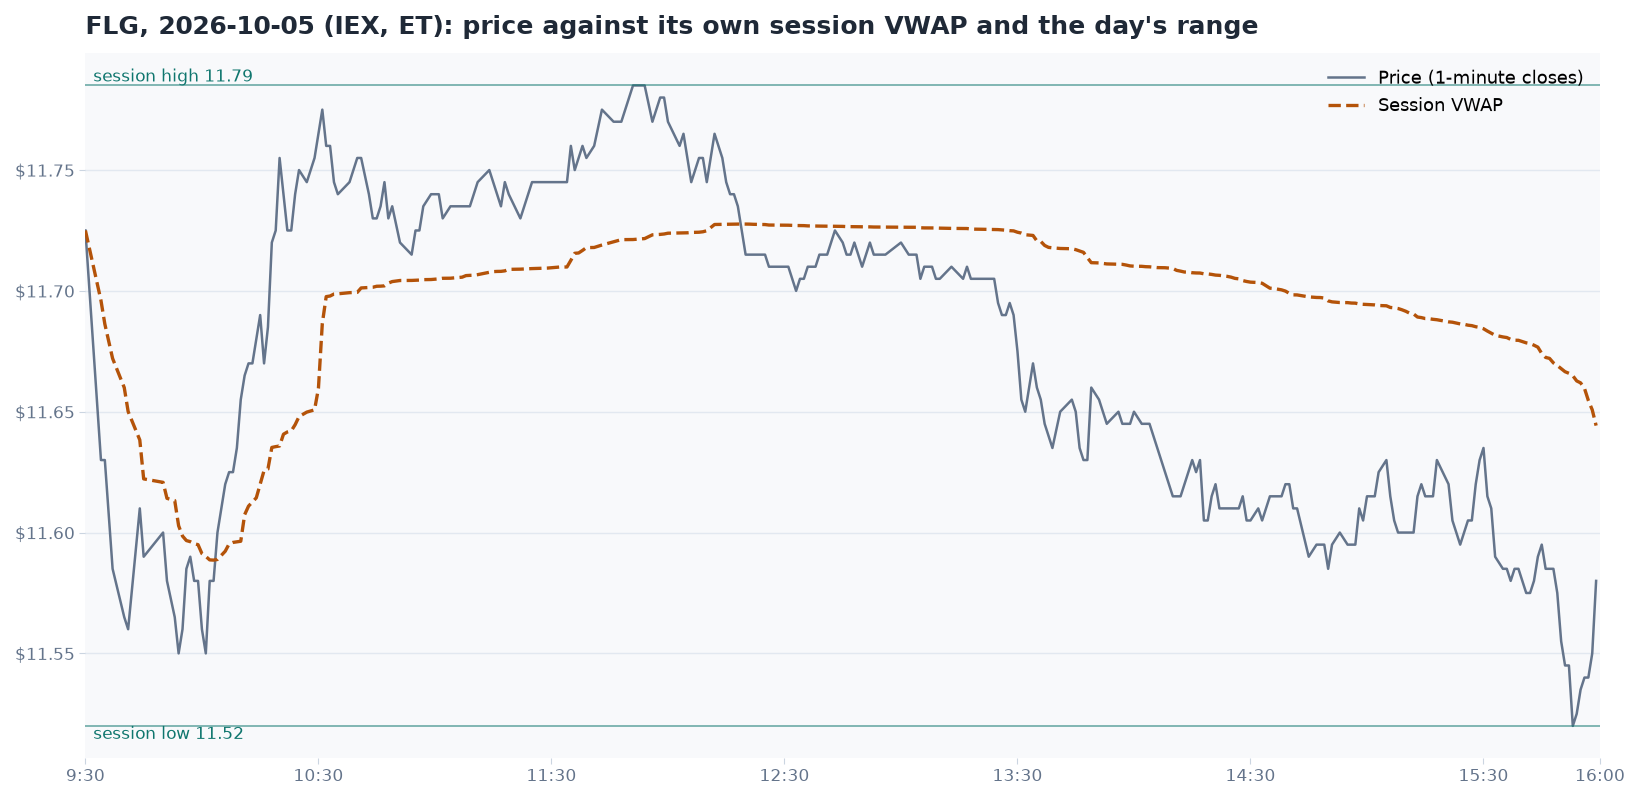
Reading the Session: VWAP, the Day's Range, and Relative Volume
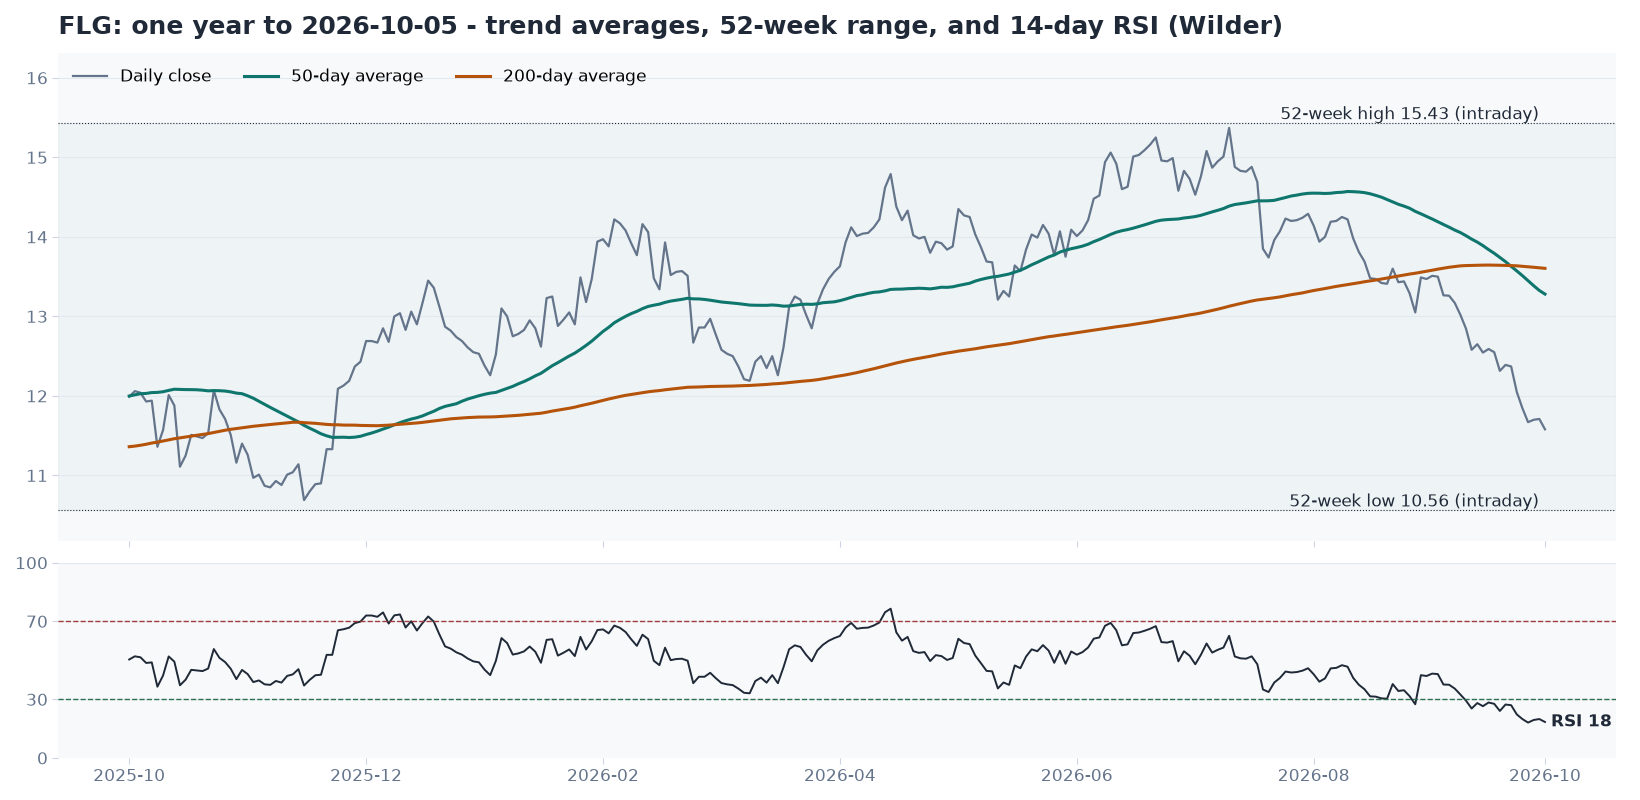
A case study of one real session — Flagstar (FLG) on 2026-10-05 — read through the four numbers every Daily Study card shows: open and close, the day’s range, VWAP, and relative volume.
Start the lesson →
Educational and descriptive content only — never investment advice. See our Disclaimer.