
Where the Numbers Come From: IEX Prices and SEC Filings
Educational content, not investment advice. See our Disclaimer.
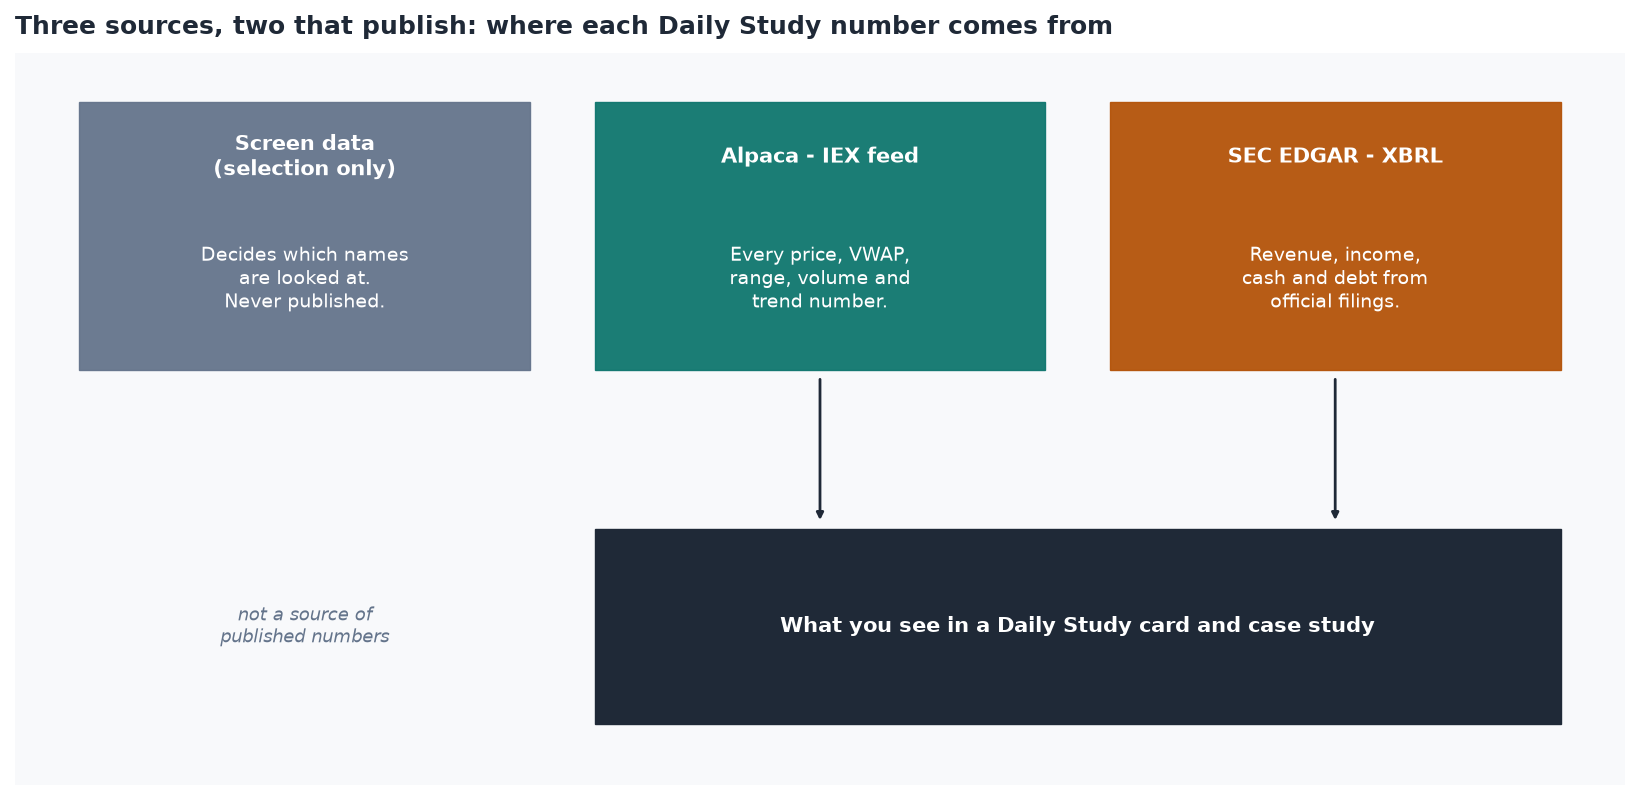
Three sources, two that publish
The screening data that decides which names are looked at is used for selection only. Nothing from it appears on the page. Every published number comes from one of two places: market data from Alpaca’s IEX feed, or financial data from the company’s own filings on SEC EDGAR. Keeping the two roles apart means every number you read on a case study can be traced to a named, public source.
The IEX feed: real prices, partial volume
IEX is one US stock exchange among more than a dozen. The IEX feed reports the trades that happen on IEX, in real time, with real prices — but only the volume traded on that one venue, not the consolidated total across every exchange and off-exchange venue.
In practice, prices on IEX track the consolidated market closely, while IEX volume is a small fraction of the total. KinderCare (KLC) passed a screen on 2026-10-05 that requires at least 500,000 shares of average daily volume across all venues, yet its 20-day average on IEX alone was about 32,000 shares a day.
That is why the Daily Study never compares IEX volume to anyone else’s number. Relative volume — the session’s volume divided by the stock’s own 20-day average — compares IEX to IEX, so the ratio stays meaningful even though the raw counts are small. Daily bars are also unadjusted: past prices are shown as they actually traded, not restated for later splits or dividends.
SEC EDGAR: the companies' own filings
Since 2009, public companies tag the numbers in their 10-K and 10-Q filings with a standard vocabulary called XBRL, and the SEC publishes that tagged data for free. The financial tables on each case study — revenue, operating income, net income, cash and long-term debt — come straight from it, with the fiscal year and the date of the report shown next to each figure.
Two caveats. Companies do not always use the same tags, and some industries report differently — banks, for example, do not report “revenue” the way a retailer does. And some filers stop using a tag altogether. When the latest value is missing or more than two years older than the rest, the case study shows “n/a” instead of a stale number. The Common SEC Filings lesson explains which filing contains what.
What is never published
No composite score, no price target, no entry, stop or exit level, and no number taken from the screening data. If a figure cannot be traced to the IEX feed or an SEC filing, it does not go on the page.
When the numbers are taken
The US market closes at 4:00 p.m. Eastern Time. The Daily Study is built after the close, from the finished session, so every intraday figure covers the full day from 9:30 a.m. to 4:00 p.m. — not a snapshot from the middle of the afternoon.