
Reading the Trend: Moving Averages, the 52-Week Range, and RSI
Educational content, not investment advice. See our Disclaimer.
Moving averages: where price sits against its own past
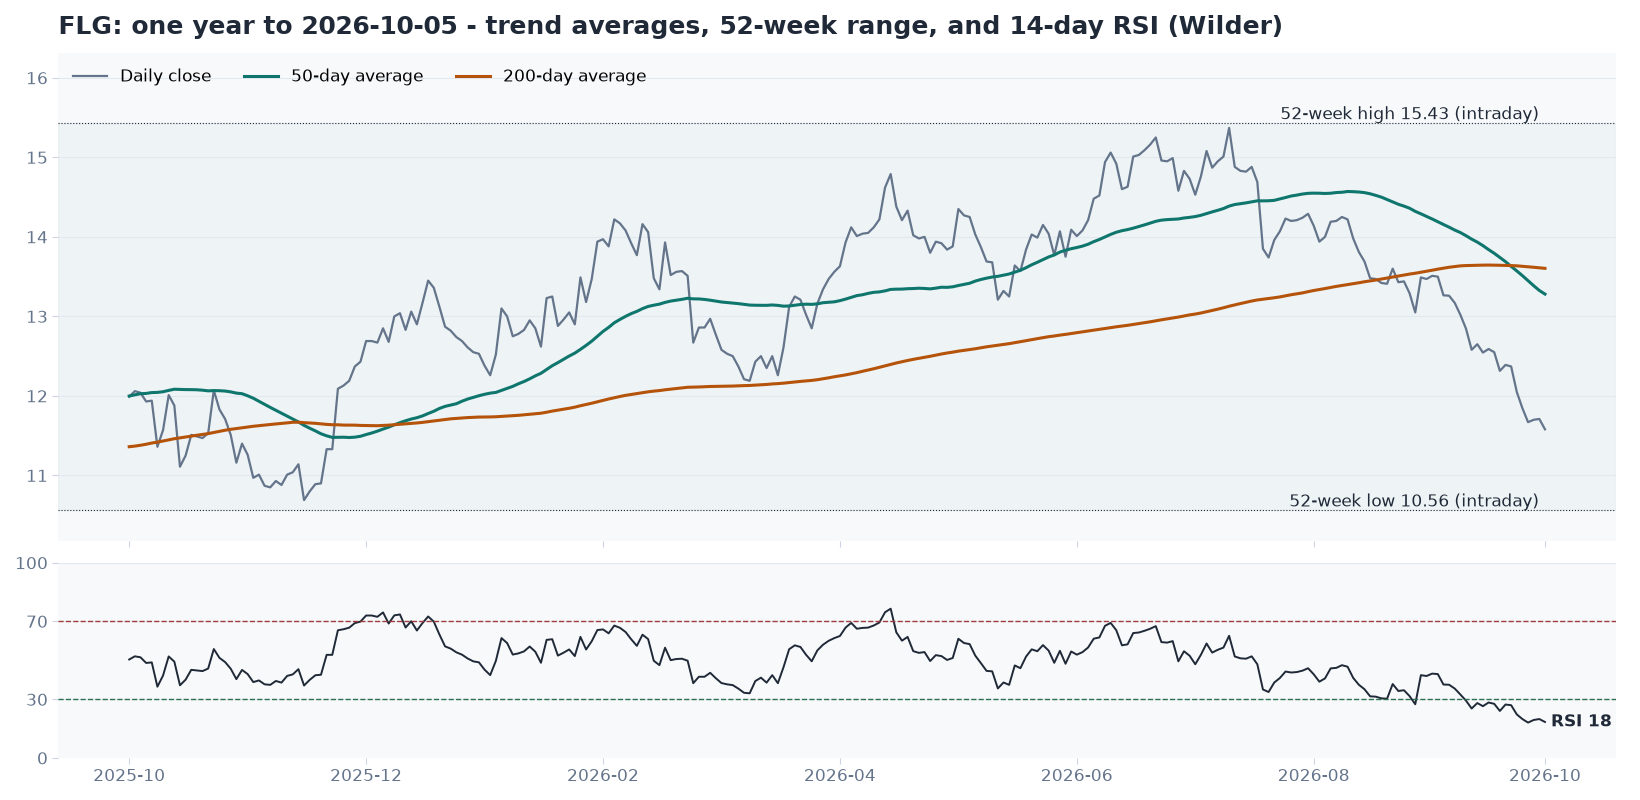
A 50-day moving average is the average closing price of the last 50 sessions; a 200-day average covers roughly the last ten months. On 2026-10-05, Flagstar (FLG) closed at $11.58, while its 50-day average was $13.29 and its 200-day average $13.62. Price was below both, and the 50-day had crossed below the 200-day in mid-September after sitting above it for most of the year.
Put plainly: the recent average price is lower than the longer-run average price, and the current price is lower than both. That describes a decline that has already happened. Popular Technical Indicators covers why the 200-day line in particular gets so much attention.
Position in the 52-week range
The 52-week range is the distance between the highest and lowest price of the past year, using intraday highs and lows. Position in the range is where the latest close sits inside it, from 0% at the low to 100% at the high: (close − low) ÷ (high − low).
FLG’s range ran from $10.60 to $15.44, so a $11.58 close put it about 20% of the way up. KinderCare (KLC), at the bottom of the Penny group the same day, is a more extreme example: its range ran from $1.77 to $7.09 and it closed at $1.82 — about 1% of the way up, within a few cents of its lowest price of the year, after falling 63% over three months.
RSI: how stretched the recent move is
The Relative Strength Index compares the size of recent up-days with recent down-days and expresses the balance on a 0-100 scale. The Daily Study uses the standard 14-day version defined by J. Welles Wilder in 1978: the first average gain and loss are simple averages of 14 days, and every later day is blended in as (previous average × 13 + today’s value) ÷ 14. That smoothing is why RSI needs a long run of history to settle, and why simplified versions that average only the last 14 days can give quite different readings.
FLG’s RSI was 18 and KLC’s was 20. By convention, readings under 30 are called oversold and readings over 70 overbought. Both labels describe how one-sided the recent move has been — not what comes next. A stock in a persistent decline can stay below 30 for a long time, which is the indicator’s most common failure.
Putting the trend together
Read together, FLG’s trend measurements describe one consistent picture: price below its moving averages, in the lower fifth of its yearly range, after a run of losses heavy enough to push RSI under 20. That is why it sat at the bottom of its group that day. None of those measurements is a forecast. They are a precise way of saying what has already happened — which is exactly what the Daily Study sets out to do.