
Popular Technical Indicators
Technical indicators are mathematical formulas applied to price and volume data, designed to add context to what a chart is already showing. None of them predict the future with certainty, and no combination of indicators has ever been shown to work all the time — they are supplementary tools, not a substitute for reading the underlying price action.
Moving Averages
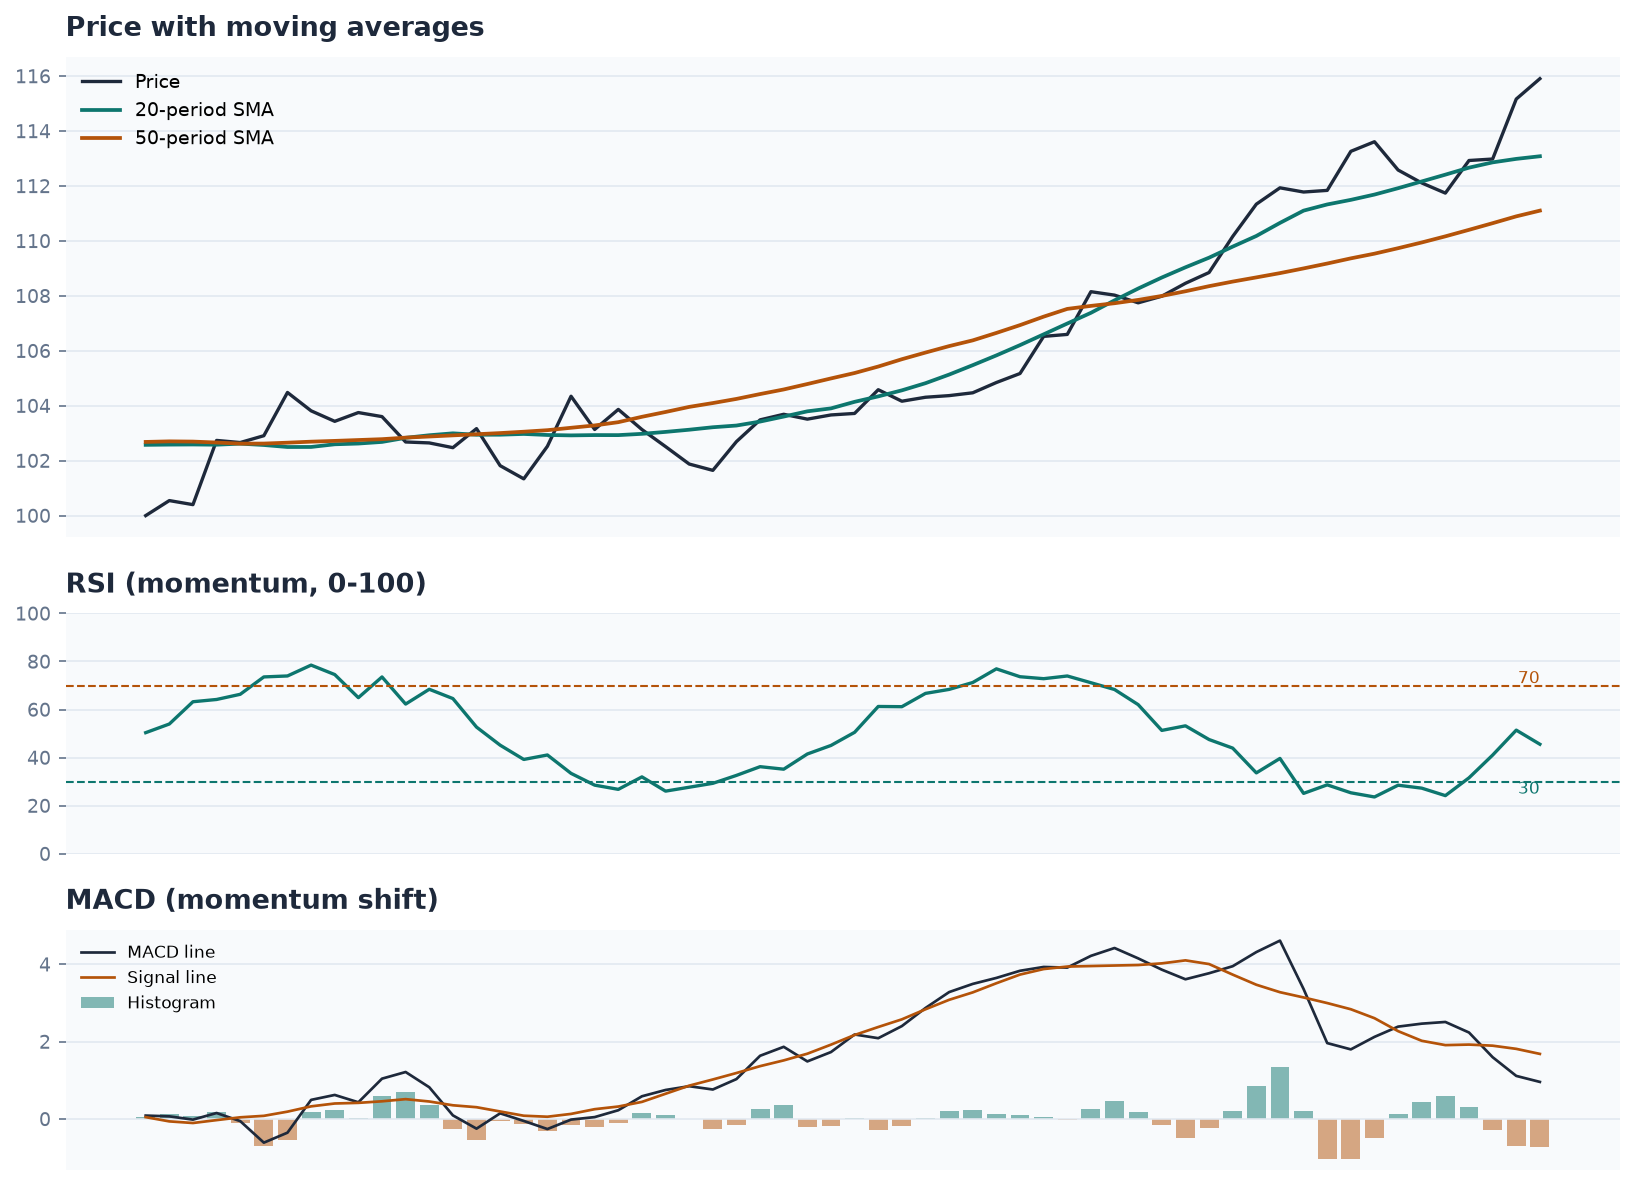
A moving average is simply the average price of a stock over a set number of recent periods. A simple moving average (SMA) weighs every period in the lookback equally; an exponential moving average (EMA) weighs recent periods more heavily, which makes it react faster to new price action — a meaningful difference when a stock is moving quickly. The most widely watched moving average across the market is the 200-period average (on whichever timeframe is in use): because so many traders watch it, a stock trading below its 200 is widely treated as showing underlying weakness, and a stock above it is treated as showing underlying strength, largely because that shared attention makes the level self-reinforcing. Shorter averages (9, 20, 50) are used for more responsive, near-term context.
VWAP (Volume-Weighted Average Price)
VWAP is a moving average that factors in the volume traded at each price, not just the price itself, which makes it a genuine measure of the “fair value” the market has collectively agreed on during the session so far. VWAP only works meaningfully on intraday charts (it resets each session) and is one of the more respected intraday reference points: a stock trading above VWAP is read as bullish for the session, below as bearish, and many momentum strategies are built specifically around breaks of or bounces off VWAP.
RSI and MACD
The Relative Strength Index (RSI) is an oscillator on a 0-100 scale that measures how extended a stock’s recent move is; conventionally, readings above 70-80 are read as overbought and below 20-30 as oversold, though a strongly trending stock can stay “overbought” for a long stretch while continuing to run, which is the indicator’s most common failure mode. MACD (Moving Average Convergence Divergence) measures the relationship between two moving averages to gauge whether momentum is building or fading. Both are widely used, but both also carry the same fundamental limitation as every indicator on this list: they describe what price has already done, not what it’s about to do.
Volume
Volume — the number of shares traded — isn’t always labeled a “technical indicator,” but it may be the single most useful piece of supplementary data on any chart. Volume confirms conviction: a breakout on heavy volume is more trustworthy than the identical breakout on light volume, because heavy volume means a large number of market participants are actually putting money behind the move, not just a handful of traders nudging a quiet stock.
Simplicity Has a Case
It’s tempting, especially early on, to stack a chart with every available indicator in search of a combination that removes uncertainty. That search doesn’t have a reliable end point — every indicator added also adds a chance it contradicts another indicator already on the chart, creating confusion rather than clarity. A smaller set of well-understood tools, used consistently, tends to outperform a crowded chart used inconsistently.