
Daily Study — 2026-10-06
This is a record of what we observed in the US stock market, not a recommendation to buy or sell anything. See the Disclaimer.
Source: Alpaca IEX feed (paper account) for prices and charts; SEC EDGAR filings for financials · Session: 2026-10-06 · Methodology: how we build this
What we looked at
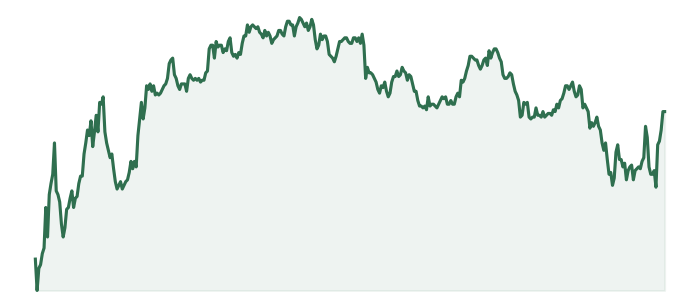
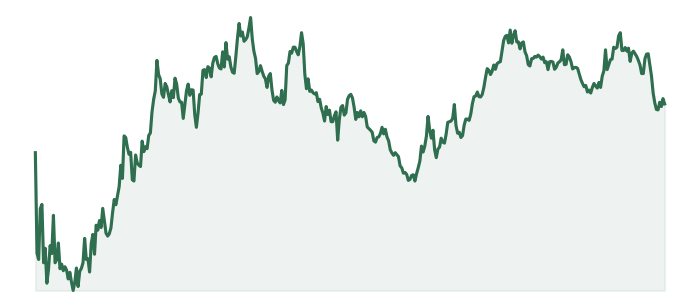
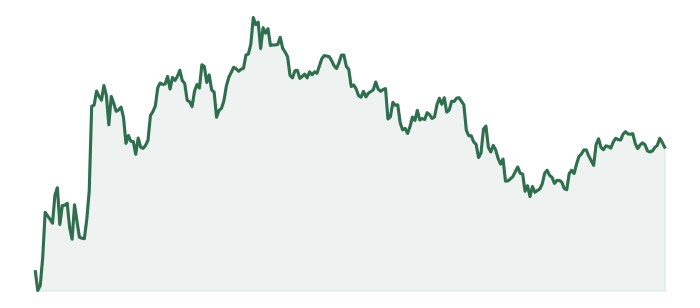
Each group starts from a broad screen, then the candidates are ordered by a combined fundamentals-and-trend read. We show the two names at the top and the two at the bottom of that order — so you see both ends of the same filter, not a pick list. Click any card for the full case study.
📖 New to this page? Start with: Reading the Daily Study · The Three Screens: From the Whole Market to Four Names · Top and Bottom of the Screen: An Ordering, Not a Verdict · Where the Numbers Come From: IEX Prices and SEC Filings
Penny Movers
Screen: Price $1–10, market cap $100M–$2B, average volume above 500K shares. 560 names matched; 25 were studied in depth.
📖 How to read these cards: The Three Screens: From the Whole Market to Four Names · Reading the Session: VWAP, the Day’s Range, and Relative Volume · Reading the Trend: Moving Averages, the 52-Week Range, and RSI



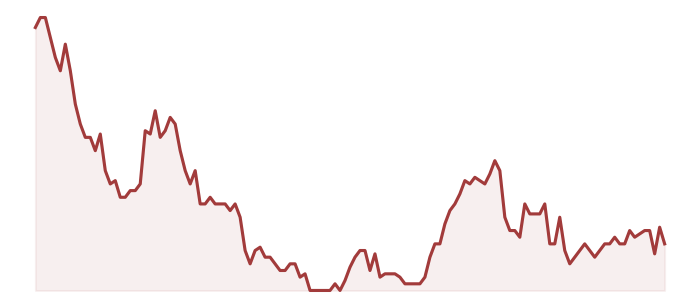




Swing Setups
Screen: Price $2–30, market cap $200M–$20B, average volume above 1.5M shares. 1,399 names matched; 25 were studied in depth.
📖 How to read these cards: The Three Screens: From the Whole Market to Four Names · Reading the Session: VWAP, the Day’s Range, and Relative Volume · Reading the Trend: Moving Averages, the 52-Week Range, and RSI

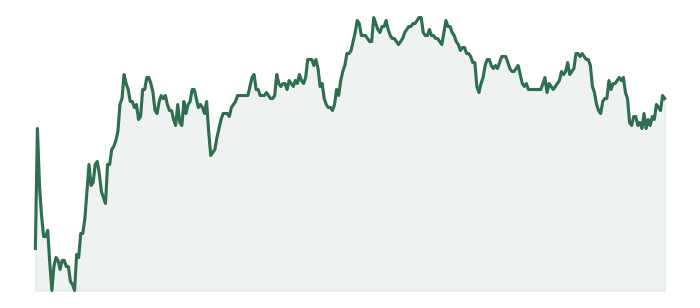

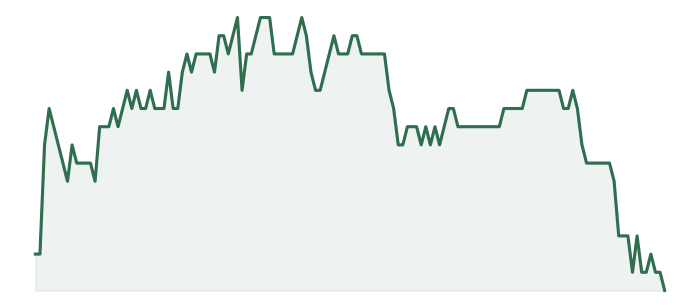

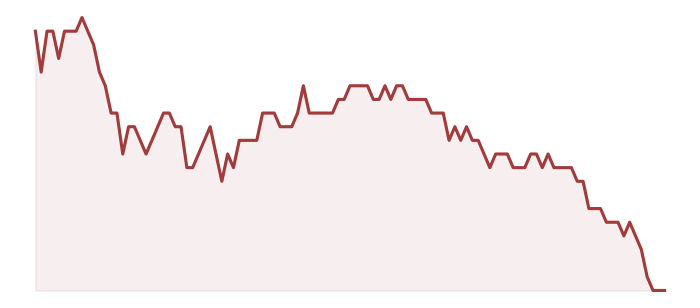

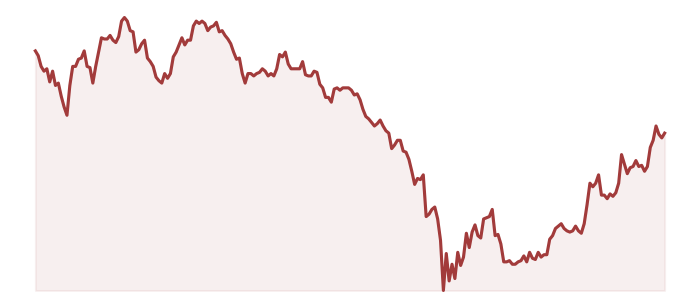
Long-Term Universe
Screen: Market cap above $10B, return on equity above 15%, debt/equity below 1. 186 names matched; 25 were studied in depth.
📖 How to read these cards: Return on Equity and Leverage · Reading the Session: VWAP, the Day’s Range, and Relative Volume · Reading the Trend: Moving Averages, the 52-Week Range, and RSI




Why
These names showed up because of where they landed in the day’s screen — top or bottom — not because of any opinion on where the price goes next. We are describing what happened, not forecasting what will.
Reminder: nothing on this page is investment advice. Past performance does not indicate future results. See the Disclaimer.