
Reading the Session: VWAP, the Day’s Range, and Relative Volume
Educational content, not investment advice. See our Disclaimer.
The session in four prices
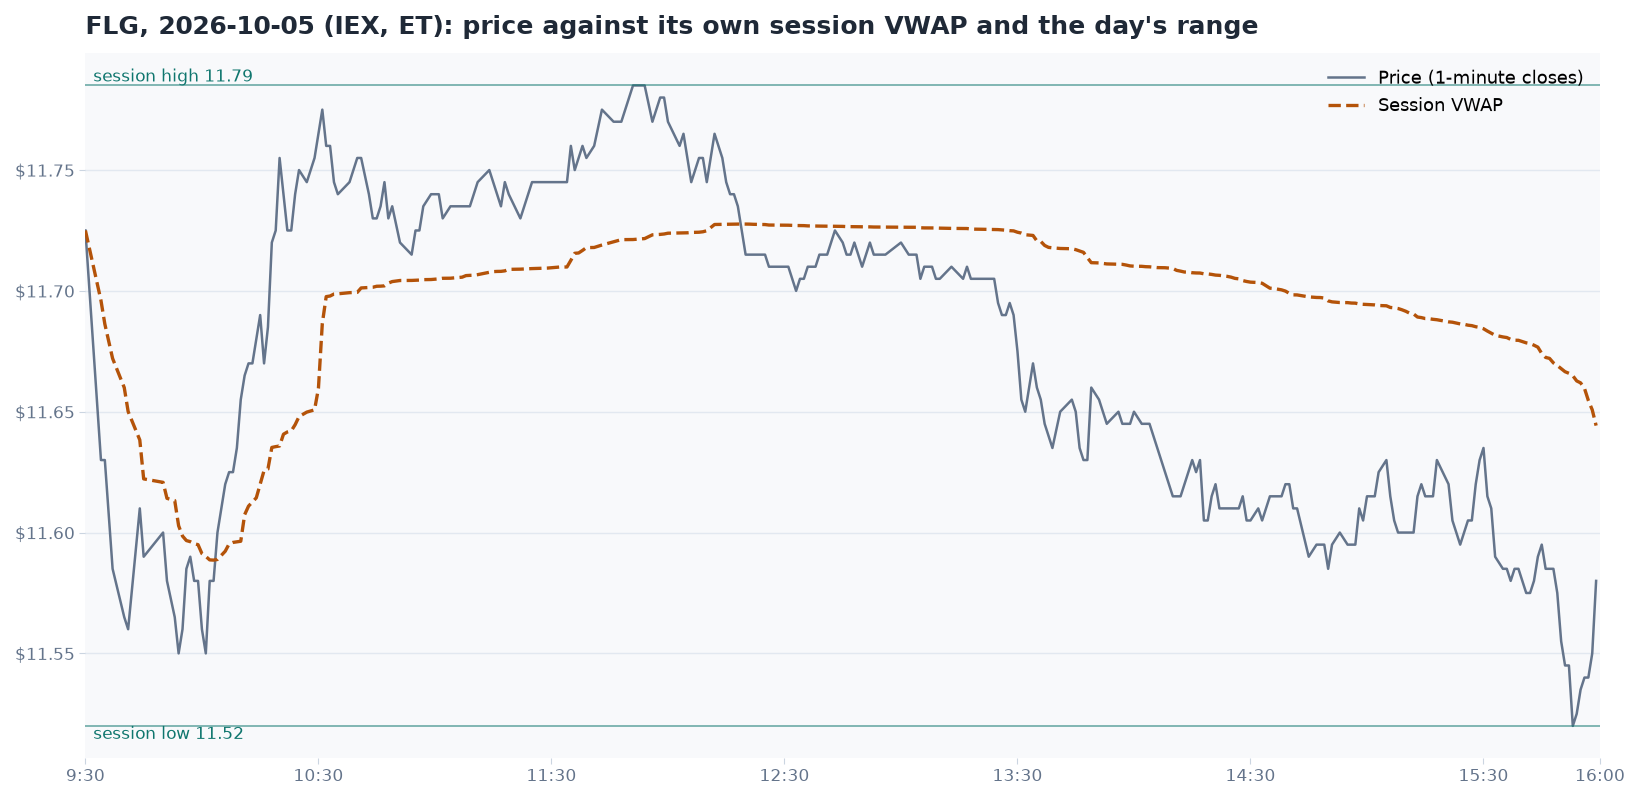
Every session has an open, a high, a low and a close. For Flagstar (FLG) on 2026-10-05: it opened at $11.73, reached a high of $11.79, fell to a low of $11.52 and closed at $11.58 — down 1.2% on the day. Those four prices say where the day started and ended and how far it stretched, but not how it got there or how much trading happened at each level.
VWAP: the average price actually paid
VWAP — volume-weighted average price — is the average price of every share traded during the session, with each price weighted by how many shares changed hands at it. It starts at the first trade and resets every morning. The Daily Study computes it from one-minute bars on the IEX feed. The theory is covered in Popular Technical Indicators; here is how it reads on a real day.
FLG’s session VWAP finished at $11.64. In the chart, price spent most of the morning above that line, peaked a little before noon, then slipped below it in the early afternoon and stayed there into the close. The close at $11.58 sat about six cents below VWAP. Described plainly: by the end of the day, the last trades were happening below the average price that the session’s buyers and sellers had paid.
VWAP describes where trading happened. It does not say where the next trade will happen, and a close below VWAP is not, on its own, a forecast of anything.
The day's range, against the stock's normal range
FLG’s range was 27 cents, from $11.52 to $11.79 — about 2.3% of the price. On its own, that number is hard to judge. Compared with FLG’s average true range over the previous 14 sessions, about 2.4% a day, it was an ordinary day in terms of how far the price traveled. A range is most useful compared with the same stock’s own history, not with other stocks.
Relative volume
FLG traded 551,512 shares on IEX that session, against a 20-day IEX average of about 399,000 — a relative volume of 1.38. In words: about 38% more shares than usual changed hands on that venue. Because both numbers come from IEX, the ratio is a fair comparison even though the raw counts are only a fraction of the consolidated total (see the previous lesson). The Stock Scanning lesson explains why relative volume matters more than raw volume.
What one session cannot tell you
A single day is a small sample. FLG’s session — an ordinary range, somewhat higher volume than usual, a close below VWAP — describes that day accurately and says very little about the next one. The next lesson steps back from the session to the trend, where FLG’s position at the bottom of its group becomes much clearer.