
Stock Scanning: Building a Daily Watchlist
Educational content, not investment advice. See our Disclaimer.
Why scanning exists
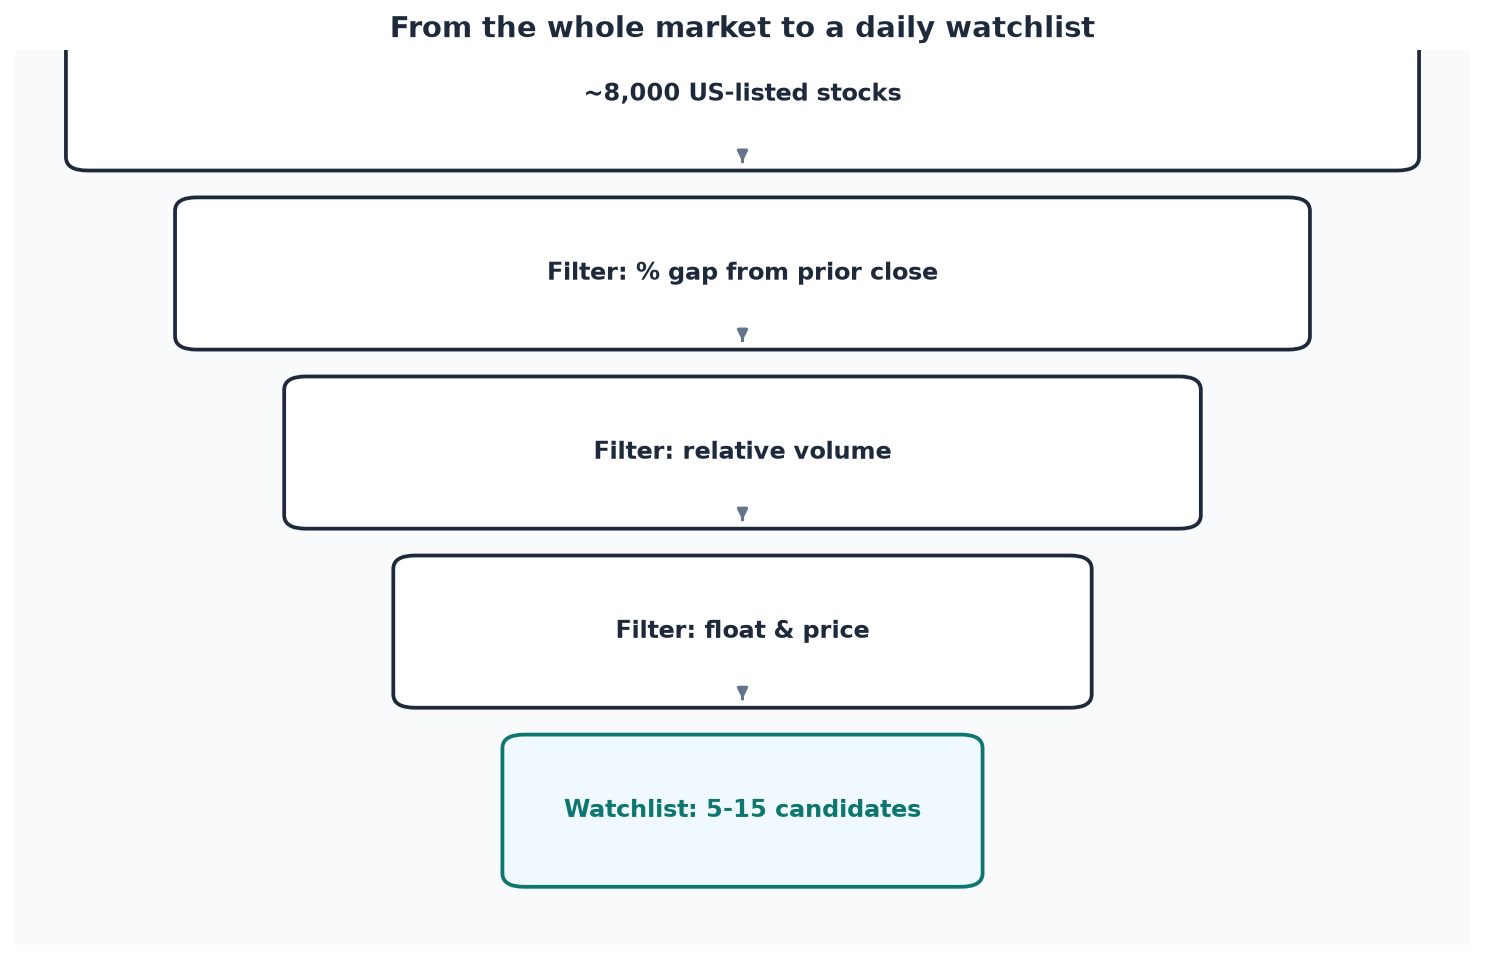
On any given day, only a small handful of US-listed stocks are experiencing an unusual, tradeable imbalance of supply and demand — the other several thousand are moving within their normal, unremarkable range. A stock scanner automates the search for that handful by filtering the entire market in real time against criteria like percentage gap from the prior close, relative volume (today’s volume vs. the stock’s own 30-day average volume at the same time of day), float, and price. Trying to find these candidates manually by scrolling through tickers you already know is a losing strategy — the stock worth watching today is very often not one you’ve traded before.
A repeatable pre-market routine
A workable daily process looks roughly like this: (1) open a gap scanner before the open and sort by percentage gap; (2) for each name near the top, check float first (lower float, roughly under ~20-30 million shares, tends to move more per dollar of buying or selling pressure than high-float stocks) and price (very low-priced stocks carry outsized percentage swings and often thinner institutional interest); (3) pull up the pre-market chart — a stock holding its gap and building a clean range is a materially different setup from one that spiked and is already fading back toward the prior close; (4) only then look for the catalyst (the next lesson covers this in depth) to understand why the stock is moving, since a move with no identifiable reason carries different risk than one tied to a clear news event.
What relative volume actually tells you
Relative volume compares current volume to that stock’s own historical average, not to the market as a whole — a small-cap trading 20x its normal volume is signaling something genuinely unusual for that specific stock, independent of its absolute share count. A large-cap trading 1.5x normal volume on an index-wide macro day is a far weaker signal. Context against the stock’s own baseline matters more than the raw number.
A disciplined filter beats a wide net
Setting a minimum gap threshold (many traders use 5% or higher) and a minimum volume floor isn’t about missing opportunities — it’s about not spending the scarce resource of attention on a stock that moved 3% on 8,000 shares of volume, which is statistical noise, not an opportunity. A scanner’s real value is cutting several thousand tickers down to a short list worth actually looking at.