
Reading the Income Statement
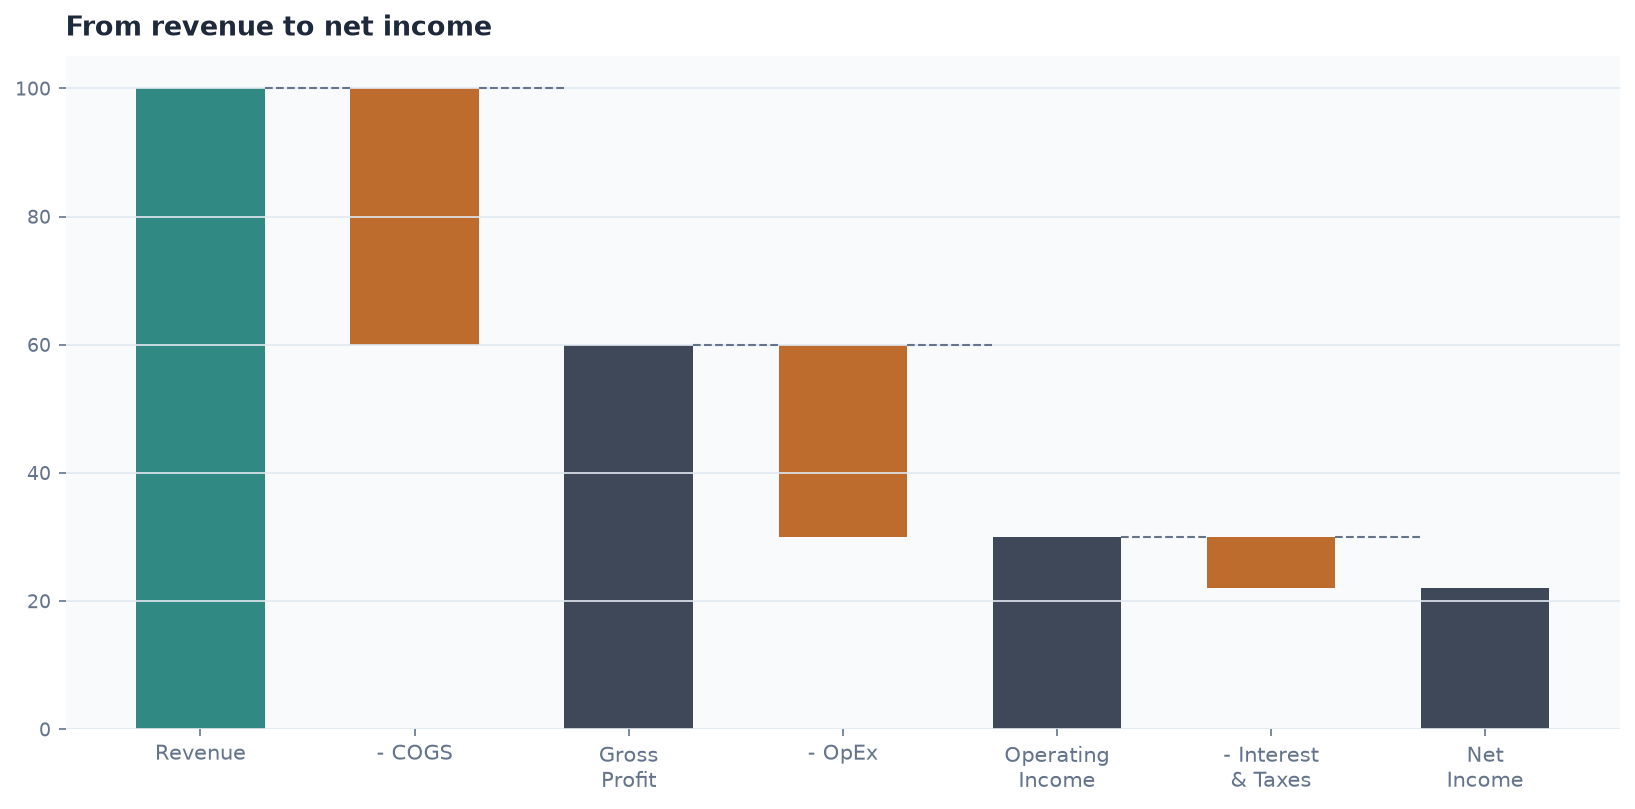
The income statement (also called the profit and loss statement, or P&L) answers a single question: over a given period, did the company make or lose money, and from what? It flows top to bottom from the broadest number to the narrowest.
Revenue and the Cost of Getting There
Revenue (or “top line”) is the total amount of money a company brought in from its core business before any costs are subtracted. Cost of goods sold (COGS) is subtracted first, leaving gross profit — what’s left after covering the direct cost of producing whatever was sold. Dividing gross profit by revenue gives the gross margin, a figure that varies enormously by industry: a software company with near-zero marginal production cost might post a gross margin above 80%, while a retailer or manufacturer moving physical goods might run in the 20-40% range. Comparing gross margin to direct industry peers is far more useful than comparing it across unrelated sectors.
Operating Expenses and Operating Income
Below gross profit, the statement subtracts operating expenses — R&D, sales and marketing, general and administrative costs — to arrive at operating income, a figure that reflects how profitable the core business is before interest payments and taxes enter the picture. Operating income (sometimes shown as EBIT, earnings before interest and taxes) is often a cleaner read on business performance than net income, because it strips out financing decisions and tax situations that can vary for reasons unrelated to how well the business itself is running.
Net Income and EPS
After interest expense and taxes, what remains is net income — the actual bottom-line profit attributable to shareholders. Dividing net income by the number of shares outstanding produces earnings per share (EPS), the single most widely quoted fundamental metric and the number most commonly compared to analyst estimates each earnings season. A company can grow EPS even with flat net income by reducing its share count (buybacks), which is one of several reasons EPS alone, without checking what drove the change, can be a misleading shortcut.
Reading Trends, Not Just One Period
A single quarter’s income statement says relatively little in isolation. The more useful read comes from comparing a company’s current results to the same quarter a year prior (year-over-year, controlling for seasonal effects many businesses have) and to the several quarters immediately before it (sequential trend). A company showing accelerating revenue growth and expanding margins over several consecutive quarters is telling a meaningfully different story than one showing the same headline revenue figure propped up by a one-time item.