
Reading Level 1 and Level 2 Market Depth
Educational content, not investment advice. See our Disclaimer.
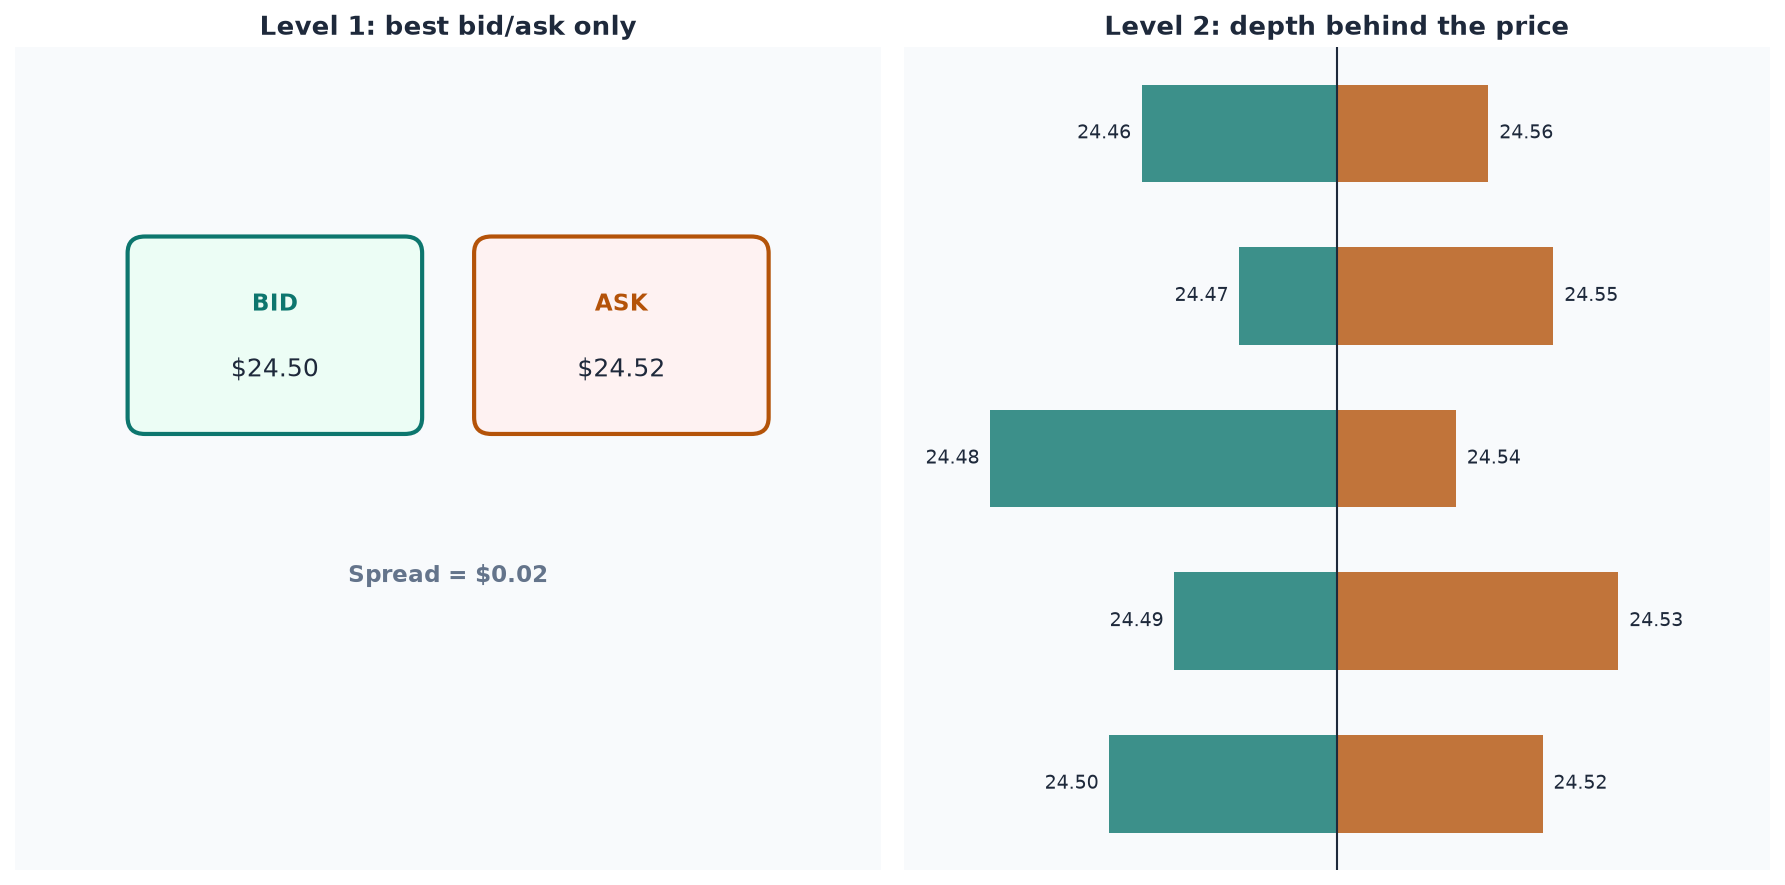
Level 1: the current best price, nothing more
Level 1 data shows the single best bid (the highest price a buyer currently wants to pay) and the single best ask (the lowest price a seller currently wants to accept), along with last trade price and volume. The gap between bid and ask is the spread. A narrow spread (often a single cent on heavily traded large-cap stocks) signals a liquid, heavily traded market; a wide spread (tens of cents, sometimes more) signals thinner trading and higher execution risk — the cost of simply entering and exiting a position grows with the spread, independent of whether the trade thesis is right.
Level 2: how much stands behind that price
Level 2 data adds depth: it shows multiple price levels on both the bid and ask side, and how many shares are queued at each, usually attributed to specific market makers or ECNs. This answers a question Level 1 cannot: is the current price backed by a thick wall of orders, or a thin one that a modest amount of buying or selling pressure could break through quickly? A stock showing large size stacked at nearby price levels (common in heavily traded names) tends to move in smaller, slower increments. A stock showing thin, scattered size (common in lower-float, less-traded names) can move through several price levels rapidly on comparatively little volume.
Float and liquidity, connected
A stock’s float — the number of shares actually available to trade, excluding long-term locked-up holdings — is the structural reason behind what Level 2 shows. A large-float stock (hundreds of millions or billions of shares, as with many large banks) has enough supply that even heavy buying struggles to move the price much; Level 2 on these names typically shows thick, tightly packed orders. A low-float stock has a limited number of shares available, so the same dollar amount of buying or selling pressure moves the price proportionally more; Level 2 on these names often shows thinner, more widely spaced orders, consistent with the bigger, faster moves these stocks are known for.
What this is useful for, descriptively
Market depth doesn’t predict direction. What it describes, in real time, is the balance of visible supply and demand at the current price and the prices just beyond it — useful context for understanding why a stock’s price is moving the way it is, and for gauging the execution risk of a position before you take it. A thin Level 2 on a volatile stock is a risk signal worth weighing regardless of what your other analysis says; a thick one on the same stock is a sign the move may take real buying or selling pressure (often tied to news) to continue.
A caution on over-reliance
More data is not automatically better decision-making. Watching every visible order several price levels away from the current price can create hesitation rather than clarity — many traders find that focusing on the top few levels, combined with price and volume action, gives a cleaner read than trying to process the entire order book. Treat Level 2 as one input among several, not a crystal ball.