
Candlestick Anatomy and Reversal Signals
Every single candlestick, on every timeframe, encodes exactly four pieces of information: the open, the high, the low, and the close of that period. A green (or hollow) candle closes above where it opened; a red (or filled) candle closes below where it opened. The thick part is the body, spanning open to close; the thin lines above and below are wicks (or shadows), marking the high and low that were reached but not held.
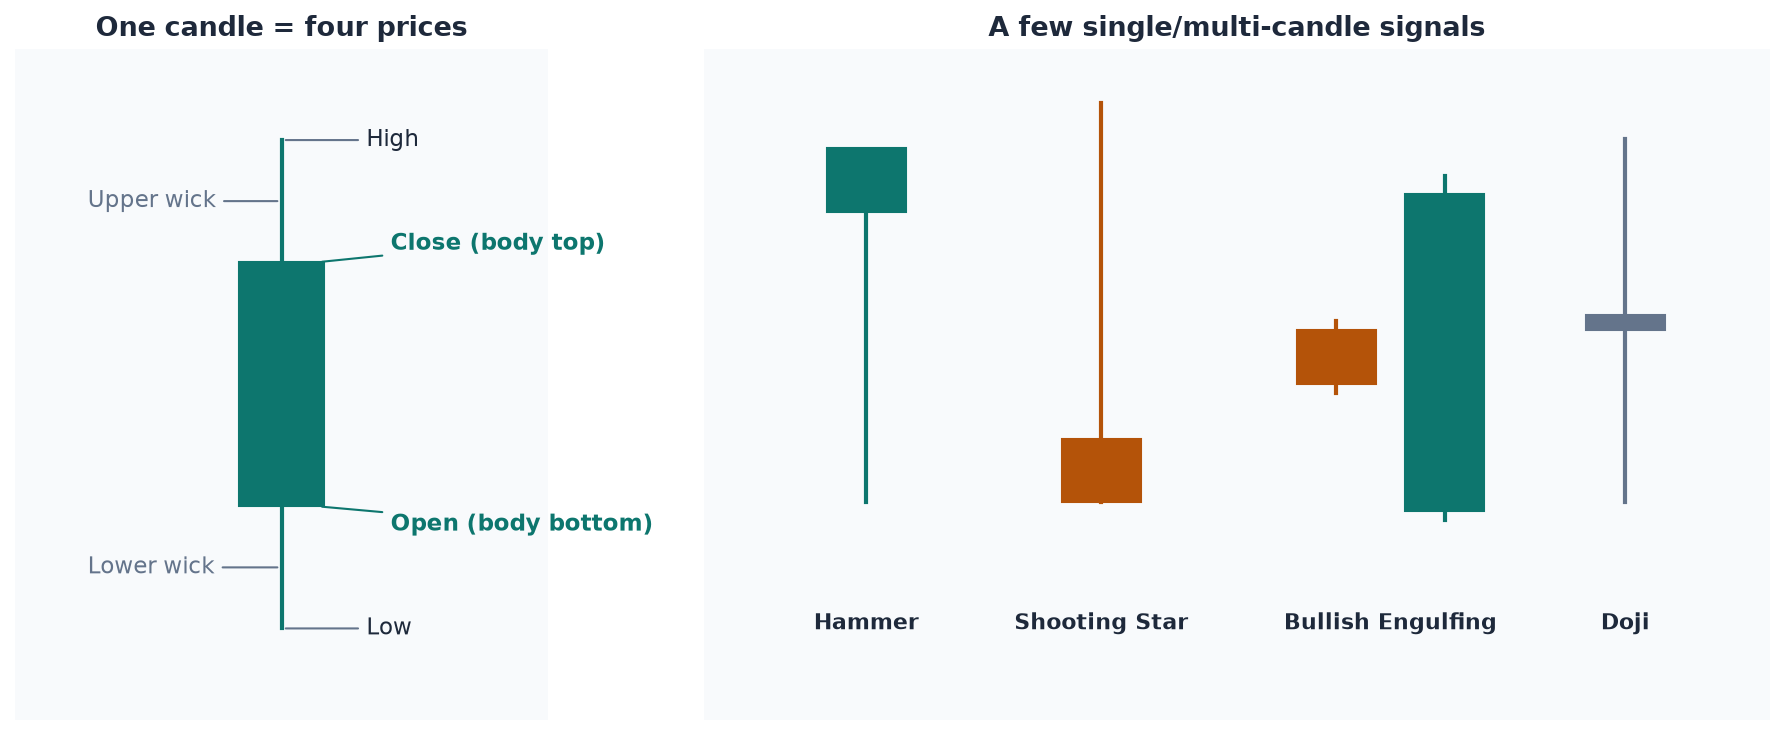
Individual Candle Shapes Worth Knowing
A handful of single-candle shapes recur often enough to have names, and each encodes a different story about the tug-of-war between buyers and sellers during that period:
Hammer (bottoming tail): a candle with a small body near the top of its range and a long lower wick, appearing after a decline. It shows that sellers pushed price down hard during the period, but buyers stepped in and pushed it back up before the close — a potential sign that selling pressure is exhausting. Shooting star (topping tail, inverted hammer at a top): the mirror image, appearing after an advance — a long upper wick with a small body near the low, showing buyers pushed price up but couldn’t hold it, and sellers took control before the close.
Doji: a candle whose open and close are nearly identical, regardless of how far price traveled during the period. A doji signals indecision, neither side won the tug-of-war. A doji after a strong directional run is a more meaningful signal than a doji during sideways, directionless action, precisely because indecision after a strong move is a change in character, while indecision during already-indecisive action tells you nothing new.
Long-body candle: a candle with little to no wick, where price moved strongly in one direction and held it through the close. This is the opposite of indecision — it shows conviction, and a run of consecutive long-body candles in the same direction is one of the cleanest signs of genuine momentum.
Engulfing candles: a bullish engulfing candle opens below the prior candle’s close and closes above the prior candle’s open, effectively swallowing the previous candle’s range to the upside, a strong reversal signal after a decline. A bearish engulfing candle does the reverse after an advance, and is one of the more unsettling patterns to see while holding a long position (owning the stock, betting it rises — the opposite of a short position, where a trader has borrowed and sold shares, betting the price falls), since it shows a sudden, decisive shift in control.
Context Determines the Signal, Not the Shape Alone
No individual candlestick shape is a trade signal by itself. The same hammer shape means something different at the bottom of a multi-day decline than it does in the middle of a tight, sideways range — in the latter case it’s just noise, because the stock wasn’t going anywhere decisively to begin with. These shapes matter most on stocks already showing above-average volume (volume is simply how many shares are changing hands — covered in full in the Popular Technical Indicators lesson) and a clear directional trend; on a thinly-traded, directionless stock, candlestick shapes carry little predictive value because too few participants are actually watching and reacting to them.