
Multi-Candle Patterns
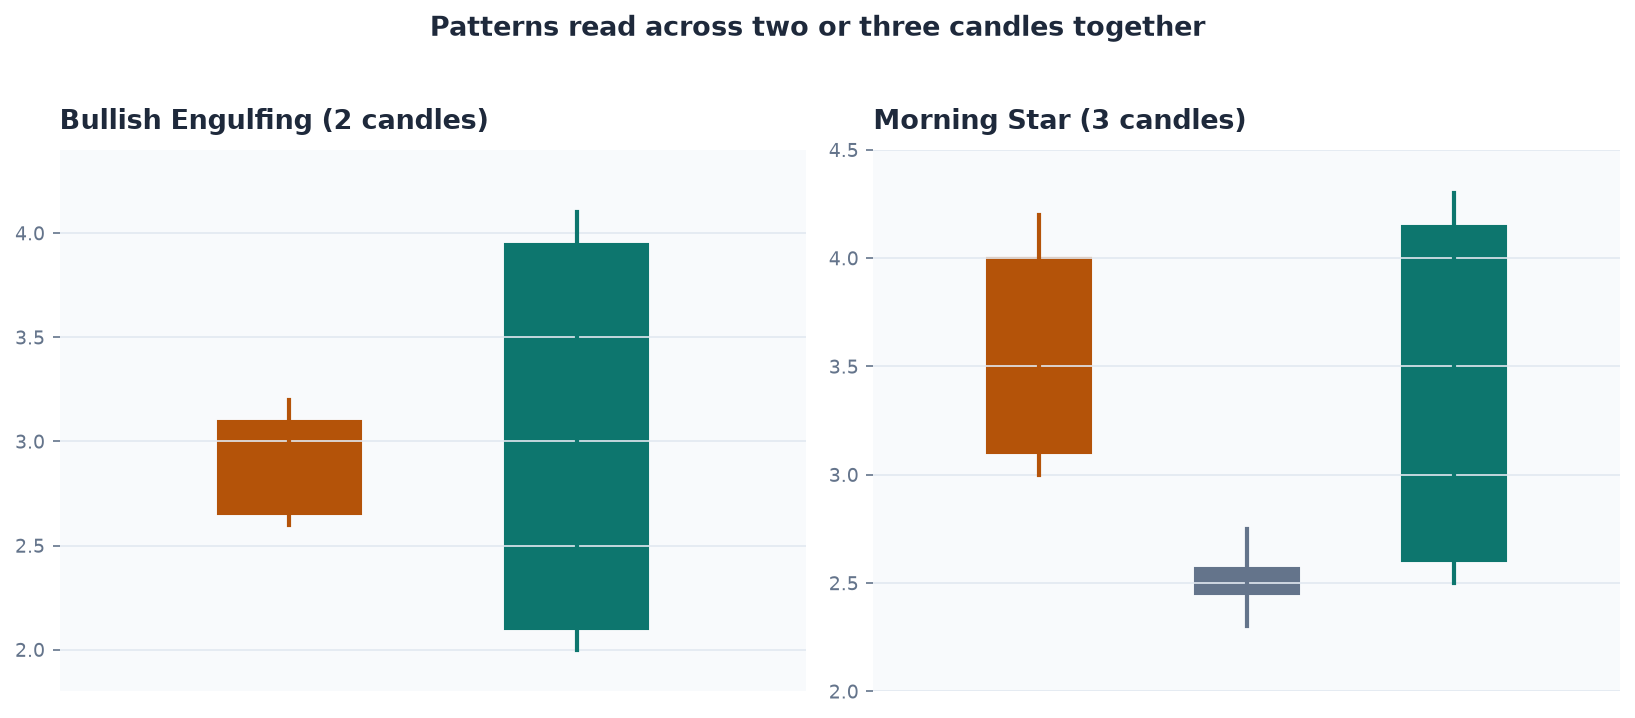
Where single-candle shapes capture a snapshot of one period’s tug-of-war, multi-candle patterns describe a short sequence of candles that together tell a more complete story about momentum, exhaustion, or consolidation. A handful of these recur often enough across stocks and timeframes to be worth knowing by name.
The Bull Flag
A bull flag is one of the most recognizable continuation patterns in momentum trading (buying a stock already making an unusually sharp move on high volume or fresh news, betting the move continues in the short term): a sharp, strong advance (the “pole”) followed by a brief, shallow, orderly pullback on lighter volume (the “flag”), after which the stock resumes its original direction. The pullback is the key tell — a genuine bull flag pulls back in a controlled, low-volume way, suggesting profit-taking rather than a change in sentiment, while a pullback that accelerates on heavy volume is a warning that the move may be reversing rather than resting. A bear flag is the mirror image during a decline.
The ABCD Pattern
The ABCD pattern describes a stock making an initial move up (A to B), pulling back (B to C), and then breaking above the prior high (B) on the move from C to D. The C point — the low of the pullback — is where many traders look for an entry, with the expectation that the stock will retest and exceed point B. This pattern is essentially a bull flag with specific reference points labeled, and the same caveat applies: the quality of the pullback (B to C) matters more than its existence.
Double Tops and Double Bottoms
A double top forms when a stock rallies to a high, pulls back, rallies again to approximately the same high, and fails to break through a second time — a sign that resistance at that level is genuinely strong enough to reject two separate attempts. A double bottom is the mirror image at a low. The second touch carries more weight than the first precisely because it shows the level held even after the market had a fresh opportunity to break it.
The Dead Cat Bounce
After a sharp, heavy decline, a stock will often bounce — sometimes significantly — before continuing lower. This bounce is commonly called a “dead cat bounce,” and the name itself is a warning: the bounce is often driven by short sellers covering positions (buying back borrowed shares to close out a bet that the price would fall) and bottom-fishing buyers, not by a genuine change in the stock’s underlying situation. Trading a dead cat bounce is a fundamentally different, higher-risk proposition than trading the front side of a genuine uptrend, since there’s no guarantee the bounce continues rather than rolling back over.
Patterns Are Probabilities, Not Promises
Every pattern in this lesson describes a tendency observed often enough to be worth recognizing — not a rule that always plays out. The same bull flag shape on a stock with strong news and high relative volume behaves differently than the identical shape on a quiet, thinly-traded stock, because the pattern’s reliability depends heavily on how many other market participants are watching and reacting to it the same way.