
Gaps and Windows on Daily Charts
A gap forms when a stock opens at a price meaningfully different from where it closed the previous session — most often caused by news breaking while the market was closed: an earnings report, a clinical trial result, an FDA decision, a secondary offering. On a daily chart, a gap shows up as empty space between one candle’s range and the next, with no trading having occurred at those in-between prices.
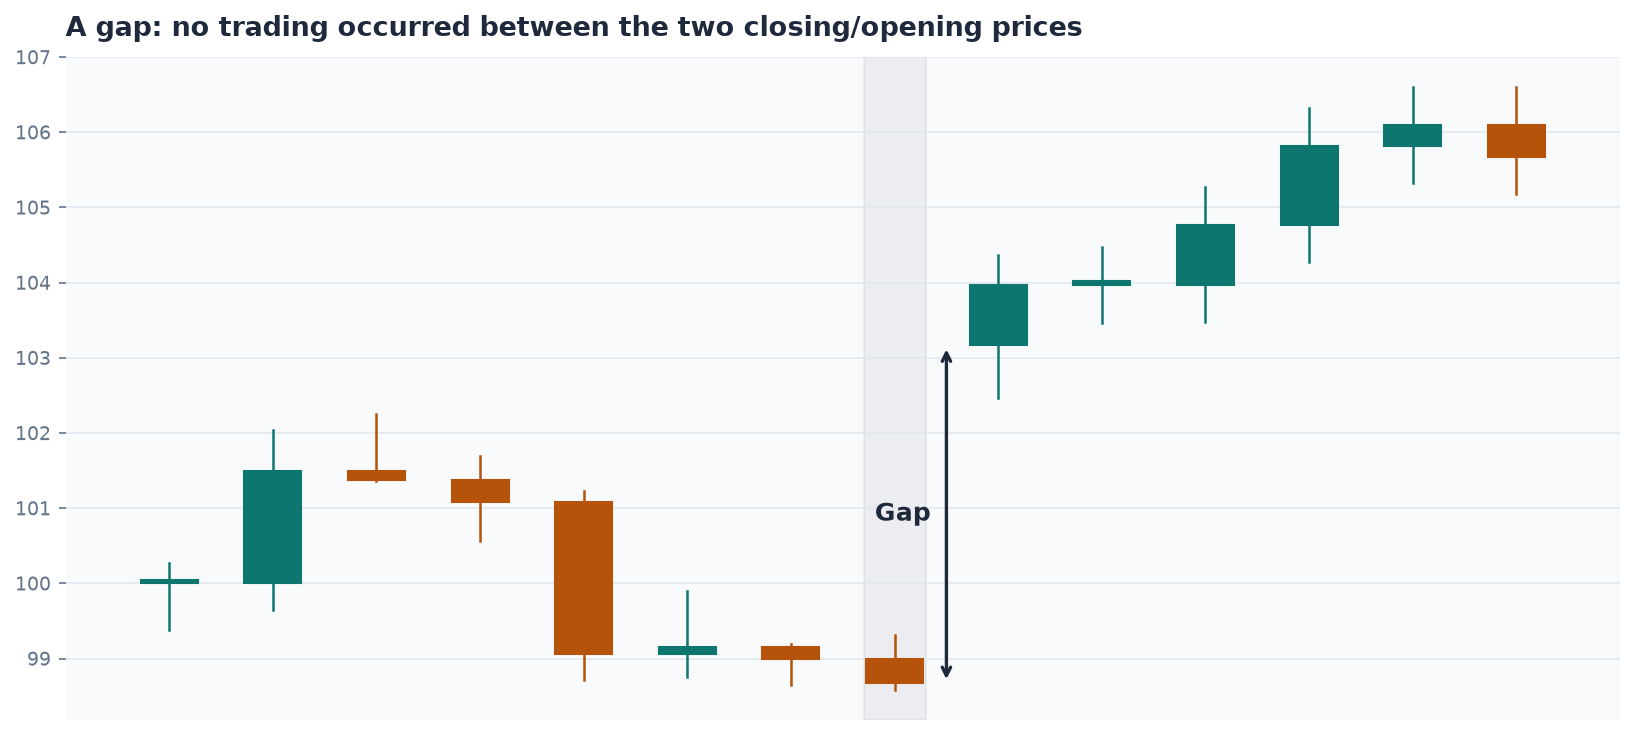
Gaps vs. Windows
A closely related concept is the window — a region of the chart with no meaningful resistance or support because price simply never traded there, whether that empty space was created by a literal overnight gap or by a single very large candle that covered a wide price range in one session. Functionally, gaps and windows behave the same way: they represent price territory nobody has fought over yet, which means there’s no built-up supply of sellers waiting to exit at breakeven and no built-up floor of buyers defending a level. A stock breaking into a wide, clean window can often move through it quickly, precisely because there’s nothing in the way.
Reading a Chart for Levels Ahead
The practical use of this concept: when assessing how far a stock might run before hitting resistance, look to the left and up on the daily chart for the nearest prior high. If that high sits right at the current price, expect a fight. If there’s a wide gap or window between the current price and the next meaningful level above, there’s room to run with comparatively little resistance in the way. A stock approaching a level with no overhead supply trapped in it has a fundamentally easier path than one approaching a level where previous buyers are sitting on losses and eager to sell the moment they can get back to breakeven, sometimes called bag holders.
Gap Fill
A gap or window often acts like a magnet, a stock that gaps up tends to attract attention back to the bottom of that gap, and gap fill refers to price eventually trading back down to close that empty space. This isn’t a mechanical law, but it’s a common enough tendency, driven by the fact that a gap represents an obvious, visually striking level that a large number of traders are independently watching and reacting to the same way.
A Practical Rule for Reading Daily Charts
A disciplined way to read a daily chart: candles are read most recent first, and a large candle effectively blocks the significance of anything before it, if a stock gapped from $2 to $10 in one session, the resistance levels that existed back at $4 or $5 before that gap are no longer meaningfully relevant, because the move already blew through that entire price territory in one motion. Chasing old levels behind a large recent move usually produces noise rather than useful signal; the levels that matter are the ones closest to current price, moving outward from there.