
Support and Resistance
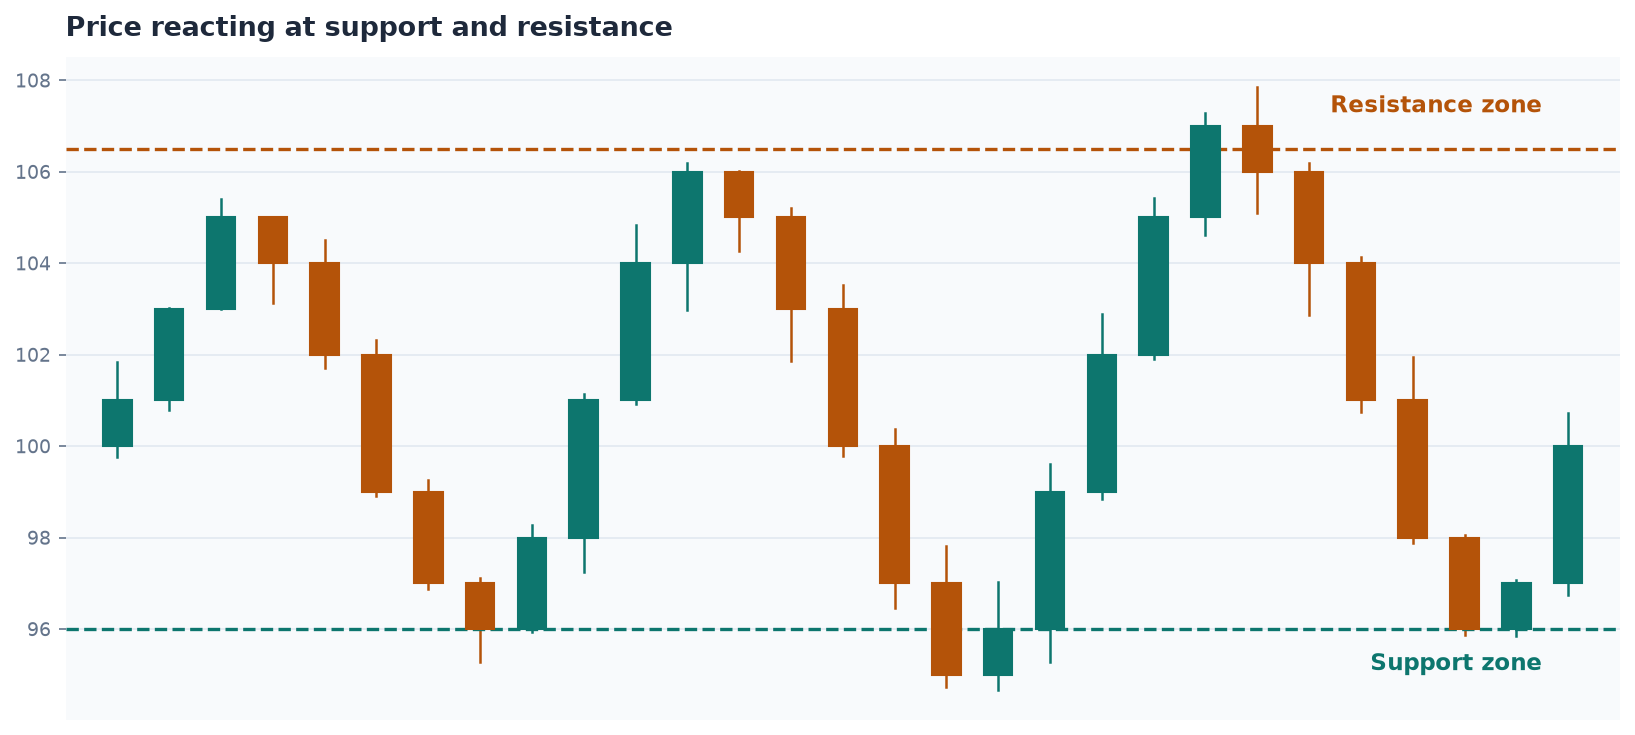
Support and resistance are the most basic and most durable concept in technical analysis: price levels where buying or selling pressure has historically been strong enough to stop or reverse a move. Resistance is a level where a stock has struggled to rise above; support is a level where it has struggled to fall below. A level becomes more significant each time it’s tested without breaking — a line touched four times and held is more meaningful than one touched once.
Horizontal Levels
The simplest form is a horizontal line drawn at a prior high (resistance) or prior low (support). These are drawn on any timeframe, from 1-minute to daily, and the logic is simple: traders who bought or sold at that price before are watching for the stock to return there, creating real buy or sell orders clustered around that level. Horizontal levels around round numbers — whole dollars and half dollars — carry extra weight for a purely psychological reason: traders tend to place orders at round numbers, which creates genuine clusters of supply and demand exactly where intuition would suggest.
Resistance Becoming Support (and Vice Versa)
One of the more useful patterns to recognize: when a stock finally breaks through a resistance level with conviction, that same level frequently becomes support on a pullback. The logic is behavioral — the traders who were selling at that level (because they viewed it as resistance) often become buyers on a retest, either to add to a now-working position or because the level that previously capped price now represents a floor of newly-converted buyers. A stock that breaks resistance, pulls back to retest that same level, and holds is showing a textbook continuation setup; a stock that breaks resistance and immediately falls back below it is showing a false breakout, which is a meaningfully different, and more bearish, signal.
Ascending and Descending Trendlines
Not all support and resistance is horizontal. An ascending trendline connects a series of rising lows, describing a stock in an uptrend where each pullback finds a floor at a progressively higher price; a descending trendline does the same for a series of falling highs. These are inherently more subjective to draw than horizontal levels — different traders connecting slightly different points will draw slightly different lines — which is exactly why the most reliable trendlines are the obvious ones: a line that requires forcing or cherry-picking specific points to make it fit is a line few other traders are seeing, and a level loses its predictive power when it isn’t collectively observed.
A Discipline, Not a Guarantee
Support and resistance describe where price has reacted before, not a guarantee of what it will do next. A level can break on heavy volume with a strong catalyst behind it, invalidating the line entirely. The value of mapping these levels isn’t certainty, it’s context: knowing where a move might stall, where a stop could reasonably sit, and where a breakout would mean something meaningful enough to be worth acting on.