
Tape Reading: Making Sense of Time & Sales
Educational content, not investment advice. See our Disclaimer.
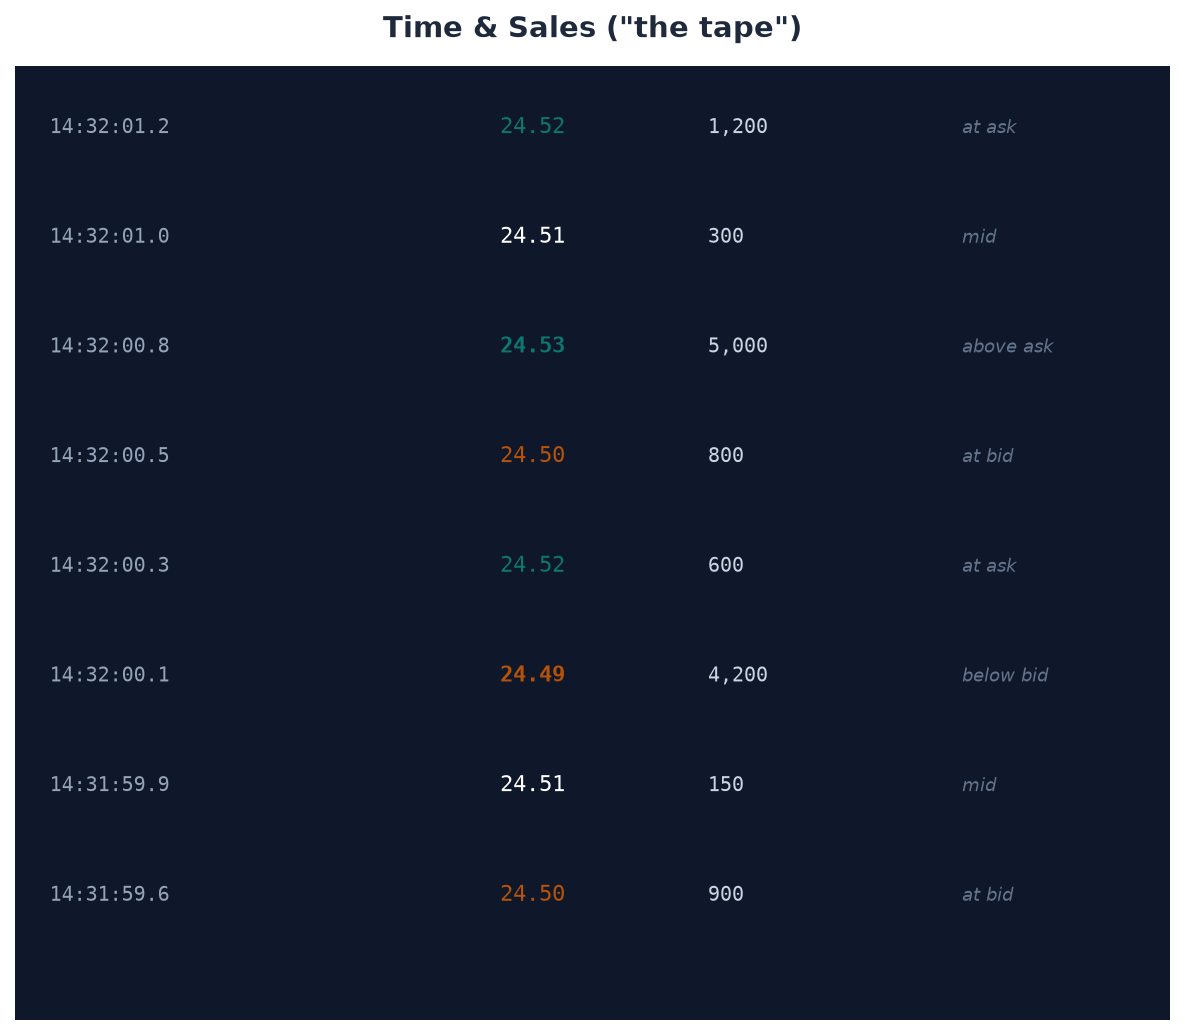
What Time & Sales actually shows
The Time & Sales window (nicknamed "the tape", after the paper ticker-tape machines used from the 1800s through the 1960s) is a scrolling log of every executed trade on a stock: price, size, and a color code showing whether the trade hit at the bid, at the ask, above the ask, below the bid, or between the spread. It records what already happened, not what happens next — which matters, because tape reading is often oversold as a crystal ball. What it reliably shows is the balance of aggression right now: are buyers repeatedly lifting the ask (bullish pressure), or are sellers repeatedly hitting the bid (bearish pressure)?
The basic color logic
Most platforms default to: trades at the bid print in one color (commonly red), trades at the ask print in another (commonly green), a trade that prints below the bid or above the ask (a market order punching through the current best price) prints in a bolder shade of the same color, and trades between the bid and ask — which happen when a hidden order gets matched, or two resting orders cross — typically print in a neutral color like white. A sudden run of bold prints above the ask, especially with increasing size, is a meaningfully different signal than the same price getting tagged one share at a time.
Why Level 2 and the tape are read together
Level 2 shows what’s resting and waiting; Time & Sales shows what’s actually getting hit. A thick wall of resting sell orders that isn’t being tested on the tape is a very different situation from the same wall being chipped away print by print. Neither view replaces a price chart — they add resolution to what’s happening at the current price, which matters most on fast, lower-float names where a five-minute candle can hide a lot of back-and-forth.
A realistic limitation
On heavily traded, high-float large-cap stocks, a large share of the print flow comes from automated order flow unrelated to any single trader’s decision — tape reading on these names tends to be noisy. It carries more signal on thinly traded, high-relative-volume names, where each print represents a larger share of the available liquidity. Tape reading also has a real learning curve: expect it to feel like noise before patterns in the color flow start to mean anything.