
Catalysts, Dilution Risk, and Red Flags
This closing lesson ties the course together around the practical question fundamental analysis is ultimately trying to answer: what might change a company’s trajectory, and what signs suggest that trajectory is already in trouble.
What Counts as a Fundamental Catalyst
A catalyst is a specific, identifiable event that can shift the market’s view of a company’s value. Common examples include earnings reports (especially when results or forward guidance differ meaningfully from analyst expectations), regulatory decisions (an FDA approval or rejection for a pharmaceutical company, for instance), new contracts or partnerships that materially change the revenue outlook, analyst rating changes (though single upgrades or downgrades typically carry less weight than a sustained shift in consensus), and M&A activity, whether a company is acquiring another business or becoming a target itself. A move with a clear, identifiable catalyst behind it carries different informational value than an unexplained move, since the former gives a concrete reason to update a view on the business and the latter may just be noise, sector-wide momentum, or a move with no fundamental basis at all.
Dilution Risk in Practice
Dilution happens when a company issues new shares, increasing the total share count and reducing each existing share’s claim on the company’s earnings and assets. The warning signs are detectable well before it happens: a shelf registration (S-3) on file, a cash runway (cash on hand divided by monthly burn rate) running short with no clear path to profitability, and a pattern of relying on financing cash flow rather than operating cash flow to fund the business, all covered in earlier lessons of this course. A stock that’s risen sharply with weak underlying fundamentals and an active shelf registration is in a materially different risk position than one with the same chart but a strong balance sheet and no registered capacity to sell new shares.
Red Flags Worth Specifically Checking For
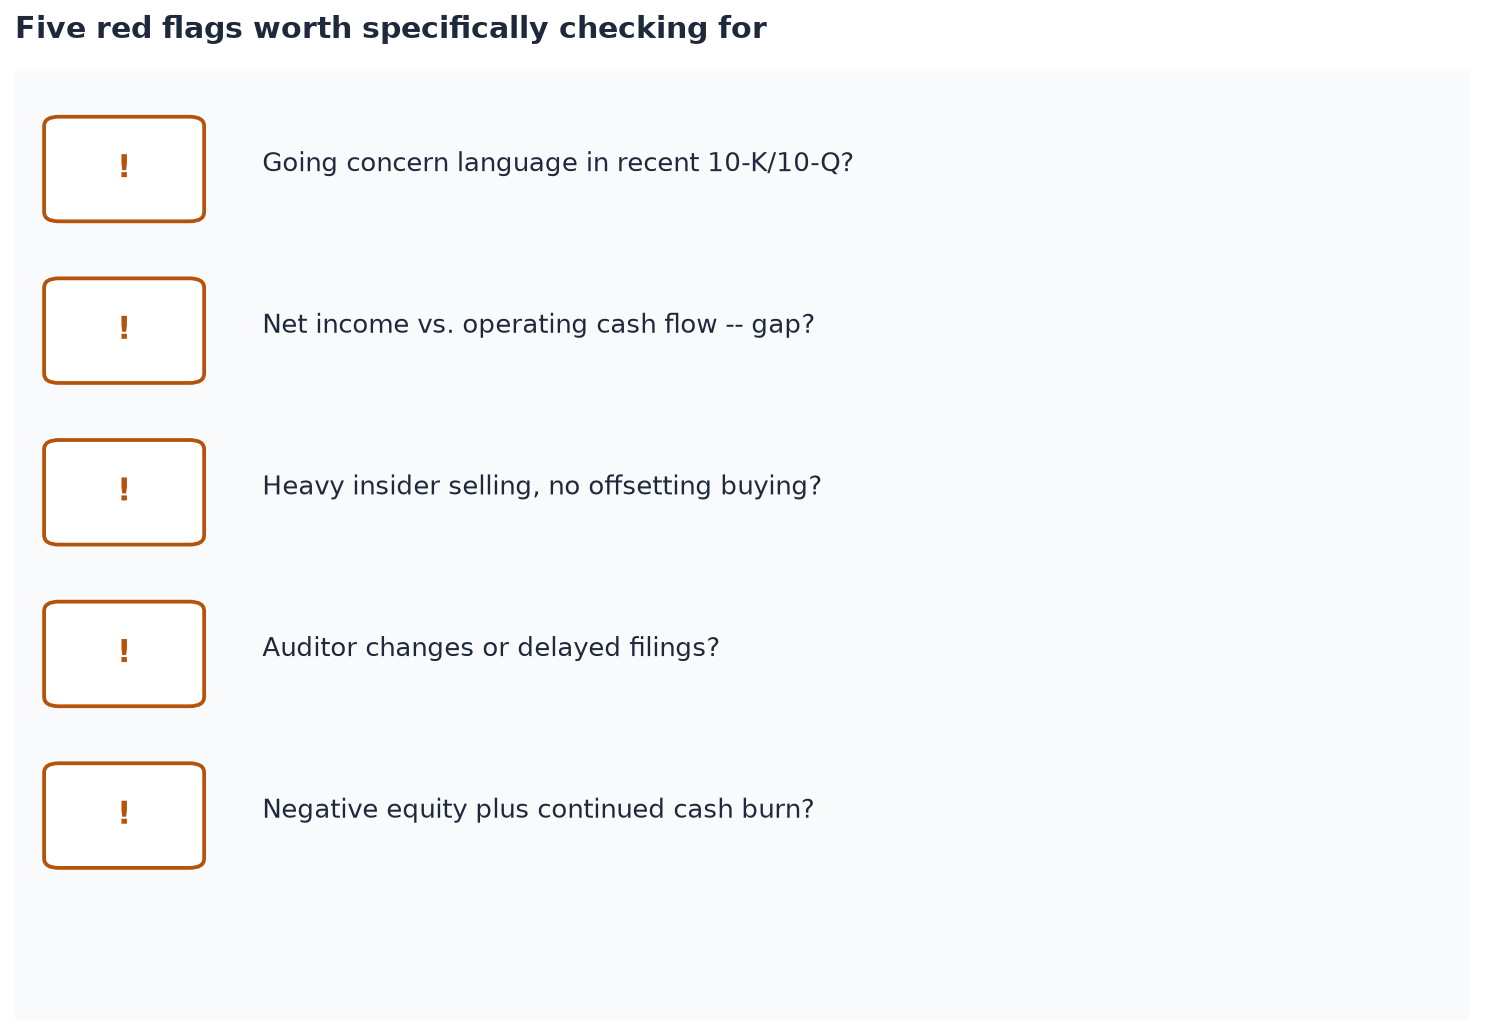
- Going concern language in the most recent 10-K or 10-Q (covered in the balance sheet lesson).
- Persistent gaps between net income and operating cash flow, where reported profit isn’t converting into real cash.
- Heavy, sustained insider selling with no offsetting buying, particularly from multiple insiders in a short window.
- Auditor changes or delayed filings, which can (though don’t always) signal deeper accounting issues.
- Negative shareholders’ equity combined with continued cash burn and no credible financing plan.
Combining This Course With the Rest of the Curriculum
None of these signals operate in isolation, and none of them replace the judgment this course has tried to build rather than hand over ready-made. A company’s fundamentals describe whether the underlying business is sound and what might change that; the technical analysis course describes what the market is currently doing with the stock; and the trading methodology course describes how to manage risk regardless of which direction either one points. Reading a stock well means pulling from all three, not leaning on any single lens as if it were complete on its own.