Daily Study

A broad down session: SPY −1.89%, QQQ −2.68%

Three screens filtered 1,877 US stocks down to 12 names on this page: the top and the bottom of each ordering. 10 of 12 closed lower and 2 higher; small caps (IWM) moved −1.64%.

SPY−1.89%
S&P 500 ETF740.04
QQQ−2.68%
Nasdaq 100 ETF661.91
IWM−1.64%
Russell 2000 ETF273.00
DIA−1.39%
Dow 30 ETF515.83
names screened
1,877
studied in depth
145
on this page
12
screens
3

A record of what moved, not a recommendation.Prices: Alpaca IEX feed · Financials: SEC EDGAR XBRLMethodologyDisclaimer

Each screen starts from a broad filter of US stocks; the candidates are then ordered by a combined fundamentals-and-trend read. The page shows the names at the top and at the bottom of that order, so you see both ends of the same filter, not a pick list. Open any case study for the session, the three-month trend and the latest SEC financials. IEX volume is only the share traded on IEX, so it is compared with its own 20-day average.

Learn more: Top and Bottom of the Screen: An Ordering, Not a Verdict · Where the Numbers Come From: IEX Prices and SEC Filings · Reading the Cash Flow Statement · Return on Equity and Leverage

504matched the screen
60studied in depth
4on this page

Top of the screen

CRCT

Cricut Inc

8.66+0.2%
TechnologyComputer Hardware
3 months+59.5%
52-week range52w low83%high
RSI (14)68
Session
at VWAP 8.660.94× avg vol
Moving averages
above 50dabove 200d
View CRCT chart on TradingView Affiliate
Case study: why CRCT is on this page

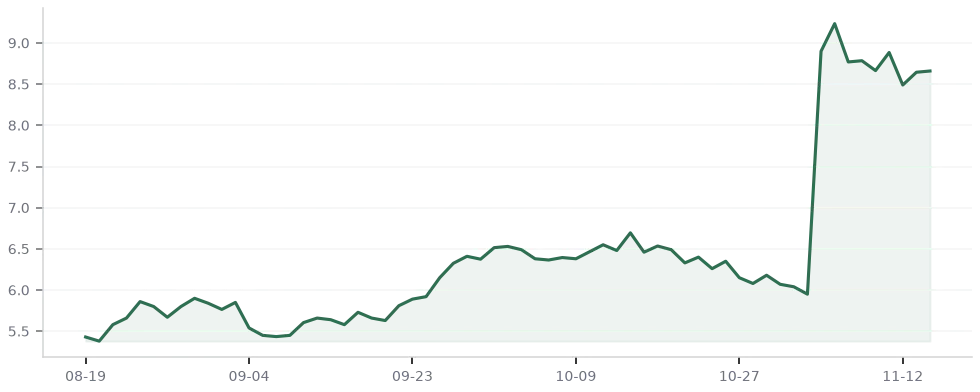
Top of this screen: profitable last fiscal year; revenue -0.5% YoY; above its 200-day average; +59.5% over 3 months.

Close 8.66: +0.2% vs previous closeSession (open→close): +0.6%

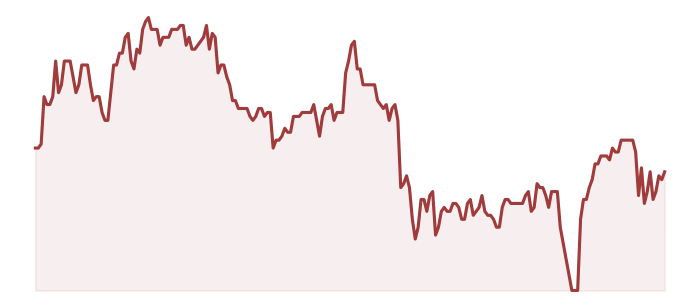
Session: day range 8.46–8.77, VWAP 8.66 (at VWAP), IEX volume 0.94× its 20-day average. Trend: +59.5% over three months, 83% of the way up its 52-week range, RSI(14) 68, above its 50-day and above its 200-day average.
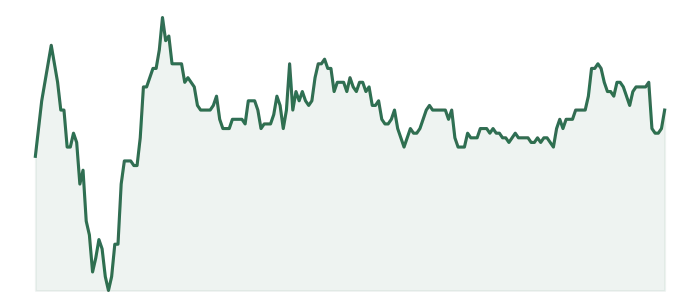
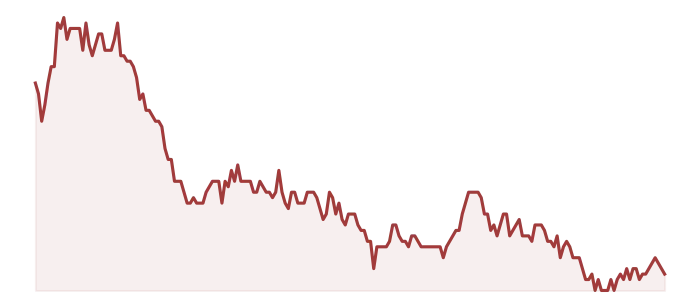
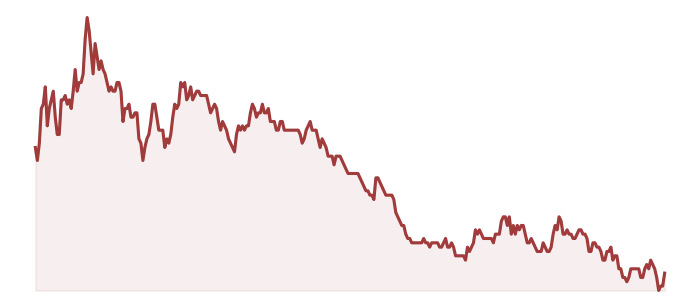
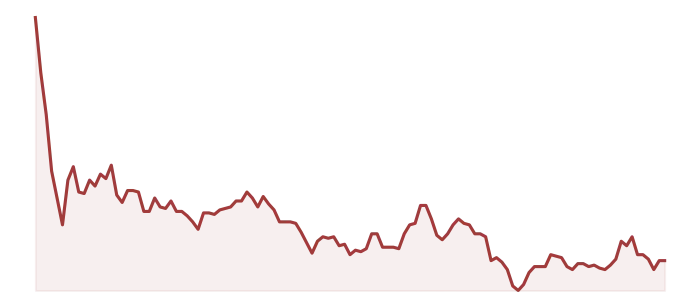
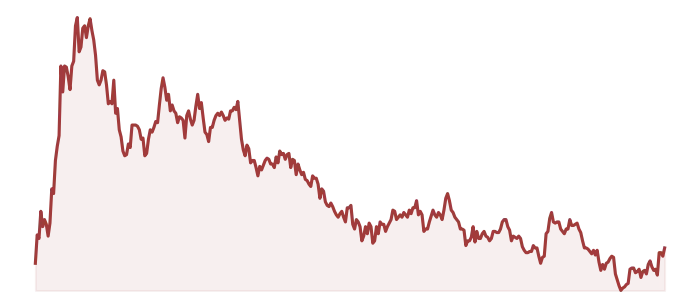
Intraday chart of CRCT on 2026-11-16
Session (intraday)
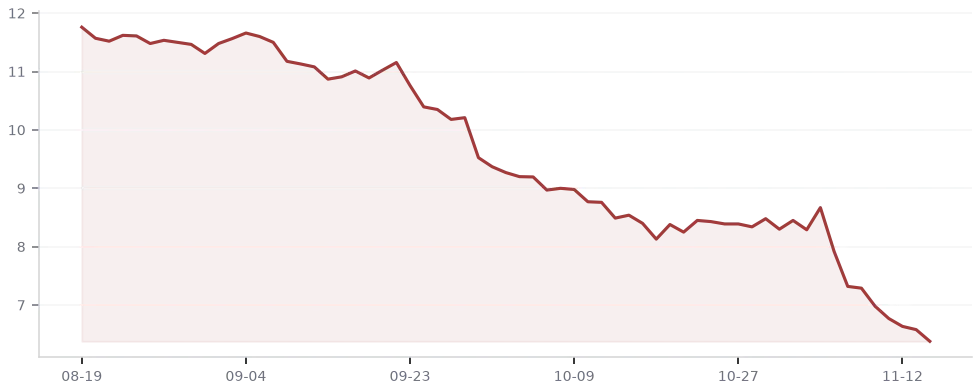
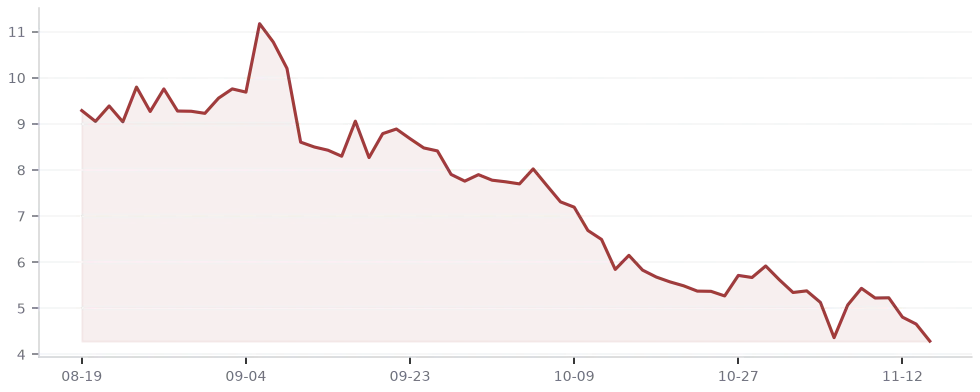
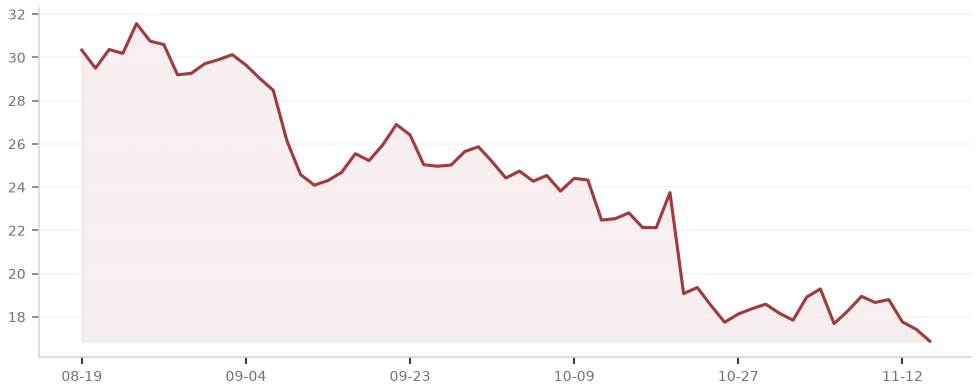
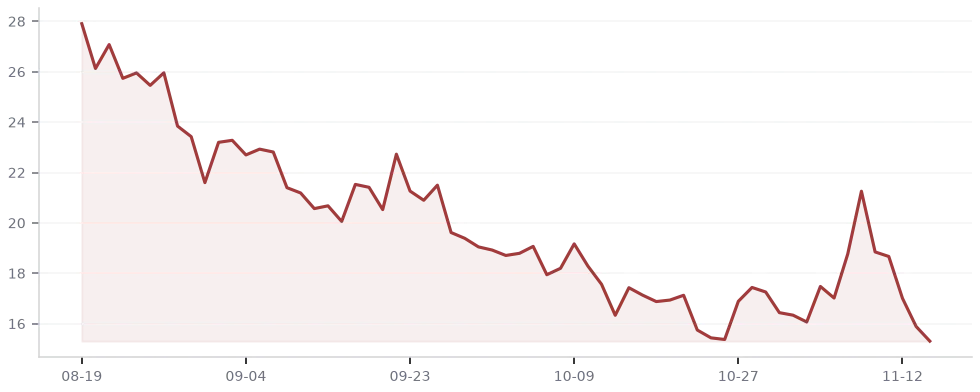
Three-month daily chart of CRCT
Three months (daily)
Revenue (latest FY)
$708.8M
Net income (latest FY)
$76.7M
Cash
$174.6M

Prices: Alpaca IEX feed · Financials: SEC EDGAR XBRL · Primary source: Cricut Inc filings on SEC EDGAR
EVC

Entravision Communications Corp

9.41−0.8%
Communication ServicesAdvertising Agencies
3 months+11.7%
52-week range52w low61%high
RSI (14)70
Session
at VWAP 9.431.37× avg vol
Moving averages
above 50dabove 200d
View EVC chart on TradingView Affiliate
Case study: why EVC is on this page

Top of this screen: a net loss last fiscal year; revenue +22.6% YoY; above its 200-day average.

Close 9.41: −0.8% vs previous closeSession (open→close): −0.3%

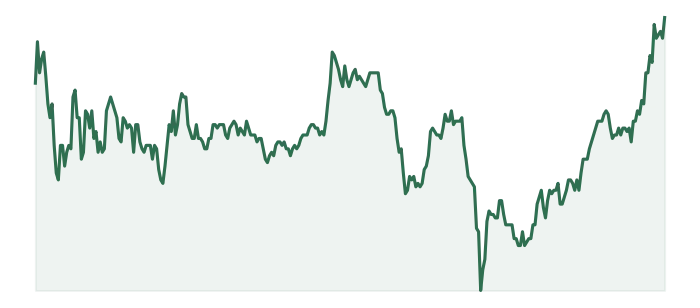
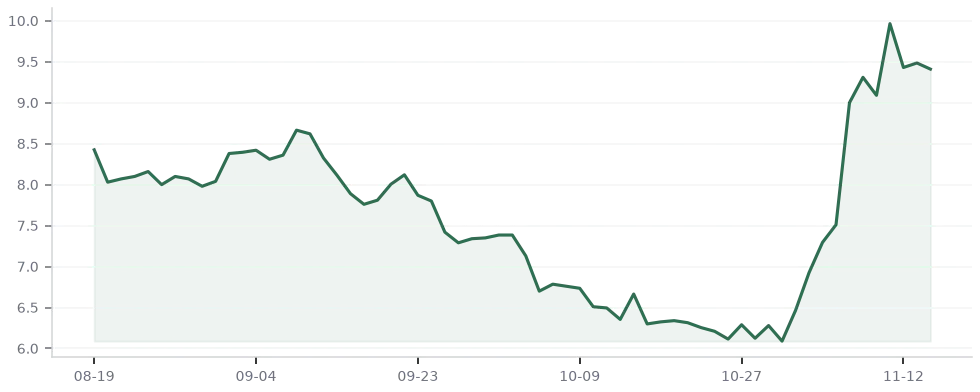
Session: day range 9.26–9.61, VWAP 9.43 (at VWAP), IEX volume 1.37× its 20-day average. Trend: +11.7% over three months, 61% of the way up its 52-week range, RSI(14) 70, above its 50-day and above its 200-day average.

Intraday chart of EVC on 2026-11-16
Session (intraday)
Three-month daily chart of EVC
Three months (daily)
Revenue (latest FY)
$447.6M
Net income (latest FY)
−$79.2M
Cash
$87.3M

Prices: Alpaca IEX feed · Financials: SEC EDGAR XBRL · Primary source: Entravision Communications Corp filings on SEC EDGAR

Bottom of the screen

CIM

Chimera Investment Corp

6.38−3.0%
Real EstateREIT - Mortgage
3 months−45.7%
52-week range52w low0%high
RSI (14)18
Session
below VWAP 6.440.76× avg vol
Moving averages
below 50dbelow 200d
View CIM chart on TradingView Affiliate
Case study: why CIM is on this page

Bottom of this screen: profitable last fiscal year; below its 200-day average; near its 52-week low; -45.7% over 3 months.

Close 6.38: −3.0% vs previous closeSession (open→close): −2.6%

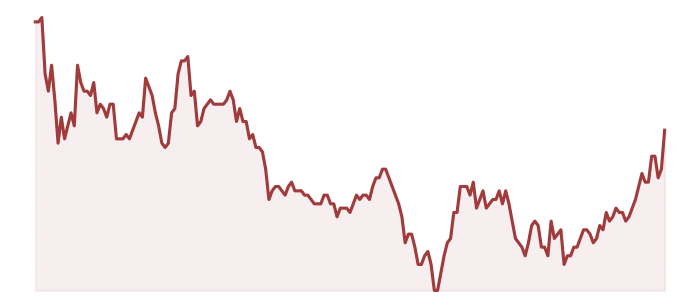
Session: day range 6.37–6.62, VWAP 6.44 (below VWAP), IEX volume 0.76× its 20-day average. Trend: −45.7% over three months, 0% of the way up its 52-week range, RSI(14) 18, below its 50-day and below its 200-day average.

Intraday chart of CIM on 2026-11-16
Session (intraday)
Three-month daily chart of CIM
Three months (daily)
Revenue (latest FY)
n/a
Net income (latest FY)
$230.5M
Cash
$357.2M

Prices: Alpaca IEX feed · Financials: SEC EDGAR XBRL · Primary source: Chimera Investment Corp filings on SEC EDGAR

SMR

NuScale Power Corp

4.29−7.9%
IndustrialsSpecialty Industrial Machinery
3 months−53.8%
52-week range52w low0%high
RSI (14)32
Session
below VWAP 4.400.70× avg vol
Moving averages
below 50dbelow 200d
View SMR chart on TradingView Affiliate
Case study: why SMR is on this page

Bottom of this screen: a net loss last fiscal year; revenue -15.0% YoY; below its 200-day average; near its 52-week low; -53.8% over 3 months.

Close 4.29: −7.9% vs previous closeSession (open→close): −3.4%

Session: day range 4.26–4.58, VWAP 4.40 (below VWAP), IEX volume 0.70× its 20-day average. Trend: −53.8% over three months, 0% of the way up its 52-week range, RSI(14) 32, below its 50-day and below its 200-day average.

Intraday chart of SMR on 2026-11-16
Session (intraday)
Three-month daily chart of SMR
Three months (daily)
Revenue (latest FY)
$31.5M
Net income (latest FY)
−$355.8M
Cash
$513.4M

Prices: Alpaca IEX feed · Financials: SEC EDGAR XBRL · Primary source: NuScale Power Corp filings on SEC EDGAR

1,348matched the screen
60studied in depth
4on this page

Top of the screen

FULT

Fulton Financial Corp

23.91−0.3%
FinancialBanks - Regional
3 months+1.2%
52-week range52w low84%high
RSI (14)56
Session
at VWAP 23.851.02× avg vol
Moving averages
above 50dabove 200d
View FULT chart on TradingView Affiliate
Case study: why FULT is on this page

Top of this screen: profitable last fiscal year; revenue -6.5% YoY; above its 200-day average.

Close 23.91: −0.3% vs previous closeSession (open→close): −0.5%

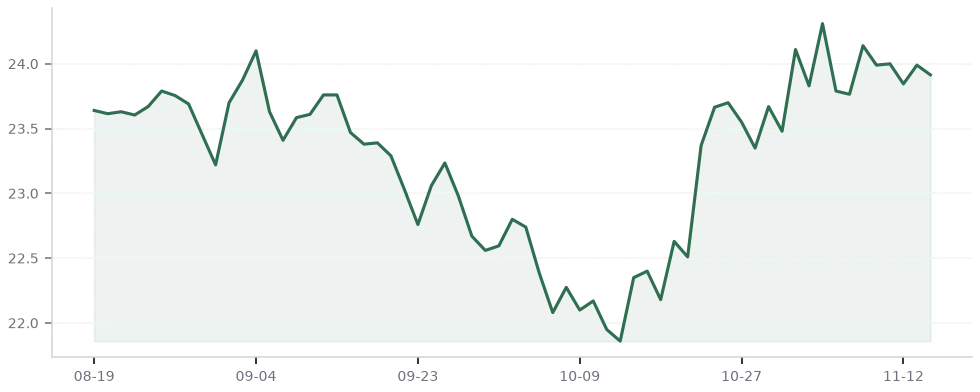
Session: day range 23.73–24.05, VWAP 23.85 (at VWAP), IEX volume 1.02× its 20-day average. Trend: +1.2% over three months, 84% of the way up its 52-week range, RSI(14) 56, above its 50-day and above its 200-day average.

Intraday chart of FULT on 2026-11-16
Session (intraday)
Three-month daily chart of FULT
Three months (daily)
Revenue (latest FY)
$276.8M
Net income (latest FY)
$391.6M
Cash
$1.11B

Prices: Alpaca IEX feed · Financials: SEC EDGAR XBRL · Primary source: Fulton Financial Corp filings on SEC EDGAR

HST

Host Hotels & Resorts Inc

25.71+0.8%
Real EstateREIT - Hotel & Motel
3 months+11.1%
52-week range52w low95%high
RSI (14)61
Session
above VWAP 25.530.77× avg vol
Moving averages
above 50dabove 200d
View HST chart on TradingView Affiliate
Case study: why HST is on this page

Top of this screen: profitable last fiscal year; revenue +7.6% YoY; above its 200-day average; near its 52-week high.

Close 25.71: +0.8% vs previous closeSession (open→close): +0.7%

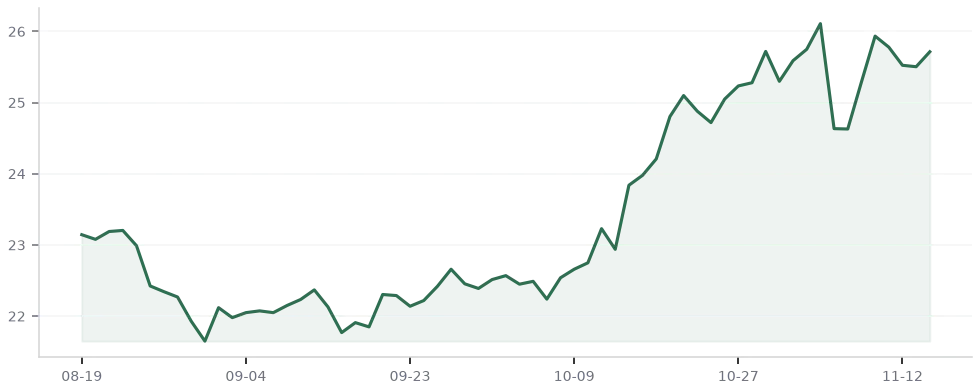
Session: day range 25.23–25.72, VWAP 25.53 (above VWAP), IEX volume 0.77× its 20-day average. Trend: +11.1% over three months, 95% of the way up its 52-week range, RSI(14) 61, above its 50-day and above its 200-day average.

Intraday chart of HST on 2026-11-16
Session (intraday)
Three-month daily chart of HST
Three months (daily)
Revenue (latest FY)
$6.11B
Net income (latest FY)
$765.0M
Cash
$1.49B

Prices: Alpaca IEX feed · Financials: SEC EDGAR XBRL · Primary source: Host Hotels & Resorts Inc filings on SEC EDGAR
Bottom of the screen

RCUS

Arcus Biosciences Inc

16.88−3.2%
HealthcareBiotechnology
3 months−44.4%
52-week range52w low1%high
RSI (14)33
Session
at VWAP 16.940.36× avg vol
Moving averages
below 50dbelow 200d
View RCUS chart on TradingView Affiliate
Case study: why RCUS is on this page

Bottom of this screen: a net loss last fiscal year; revenue -4.3% YoY; below its 200-day average; near its 52-week low; -44.4% over 3 months.

Close 16.88: −3.2% vs previous closeSession (open→close): −4.6%

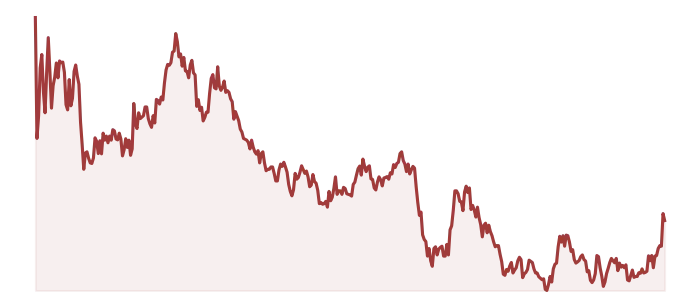
Session: day range 16.77–17.70, VWAP 16.94 (at VWAP), IEX volume 0.36× its 20-day average. Trend: −44.4% over three months, 1% of the way up its 52-week range, RSI(14) 33, below its 50-day and below its 200-day average.

Intraday chart of RCUS on 2026-11-16
Session (intraday)
Three-month daily chart of RCUS
Three months (daily)
Revenue (latest FY)
$247.0M
Net income (latest FY)
−$353.0M
Cash
$151.0M

Prices: Alpaca IEX feed · Financials: SEC EDGAR XBRL · Primary source: Arcus Biosciences Inc filings on SEC EDGAR
HYMC

Hycroft Mining Holding Corp

15.31−3.7%
Basic MaterialsGold
3 months−45.1%
52-week range52w low13%high
RSI (14)40
Session
below VWAP 15.512.30× avg vol
Moving averages
below 50dbelow 200d
View HYMC chart on TradingView Affiliate
Case study: why HYMC is on this page

Bottom of this screen: a net loss last fiscal year; below its 200-day average; -45.1% over 3 months.

Close 15.31: −3.7% vs previous closeSession (open→close): −0.1%

Session: day range 15.09–16.30, VWAP 15.51 (below VWAP), IEX volume 2.30× its 20-day average. Trend: −45.1% over three months, 13% of the way up its 52-week range, RSI(14) 40, below its 50-day and below its 200-day average.

Intraday chart of HYMC on 2026-11-16
Session (intraday)
Three-month daily chart of HYMC
Three months (daily)
Revenue (latest FY)
n/a
Net income (latest FY)
−$40.7M
Cash
$211.2M

Prices: Alpaca IEX feed · Financials: SEC EDGAR XBRL · Primary source: Hycroft Mining Holding Corp filings on SEC EDGAR

25matched the screen
25studied in depth
4on this page

Top of the screen

AAPL

Apple Inc

352.66−1.0%
TechnologyConsumer Electronics
3 months+11.3%
52-week range52w low93%high
RSI (14)57
Session
at VWAP 353.330.70× avg vol
Moving averages
above 50dabove 200d
View AAPL chart on TradingView Affiliate
Case study: why AAPL is on this page

Top of this screen: profitable last fiscal year; revenue +15.1% YoY; above its 200-day average; near its 52-week high.

Close 352.66: −1.0% vs previous closeSession (open→close): −1.2%

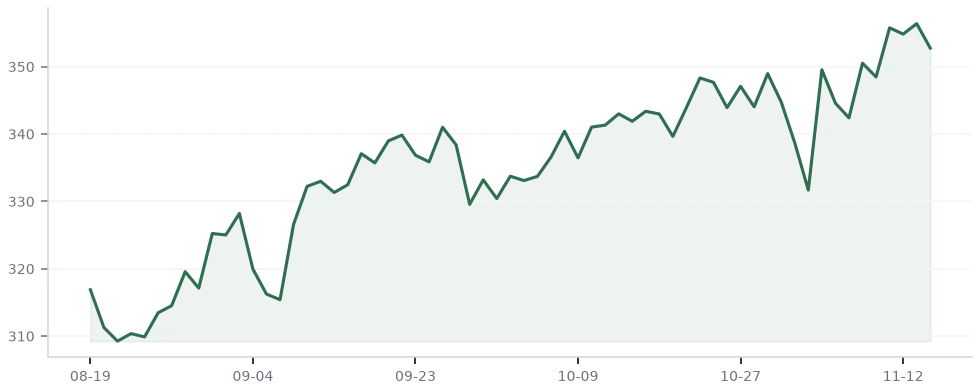
Session: day range 351.34–357.00, VWAP 353.33 (at VWAP), IEX volume 0.70× its 20-day average. Trend: +11.3% over three months, 93% of the way up its 52-week range, RSI(14) 57, above its 50-day and above its 200-day average.

Intraday chart of AAPL on 2026-11-16
Session (intraday)
Three-month daily chart of AAPL
Three months (daily)
Revenue (latest FY)
$478.83B
Net income (latest FY)
$132.18B
Cash
$36.30B

Prices: Alpaca IEX feed · Financials: SEC EDGAR XBRL · Primary source: Apple Inc filings on SEC EDGAR
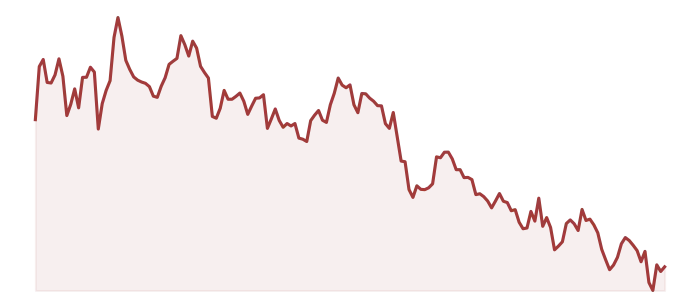
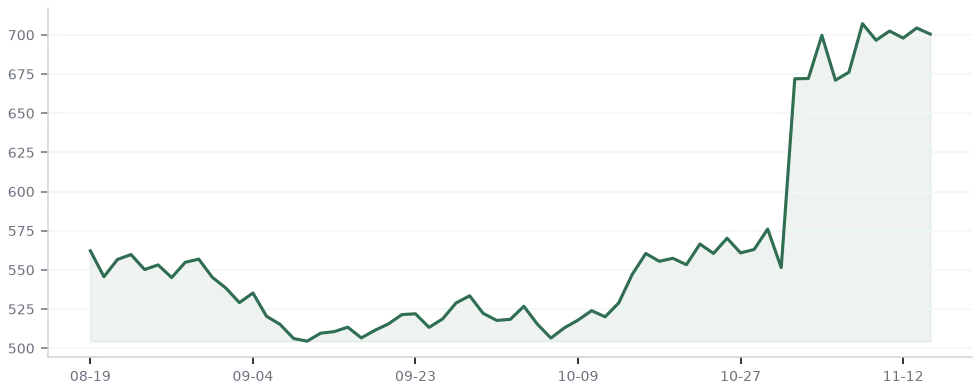
IDXX

Idexx Laboratories Inc

700.58−0.6%
HealthcareDiagnostics & Research
3 months+24.6%
52-week range52w low74%high
RSI (14)70
Session
below VWAP 705.740.94× avg vol
Moving averages
above 50dabove 200d
View IDXX chart on TradingView Affiliate
Case study: why IDXX is on this page

Top of this screen: profitable last fiscal year; revenue +10.4% YoY; above its 200-day average; +24.6% over 3 months.

Close 700.58: −0.6% vs previous closeSession (open→close): −0.8%

Session: day range 699.26–711.87, VWAP 705.74 (below VWAP), IEX volume 0.94× its 20-day average. Trend: +24.6% over three months, 74% of the way up its 52-week range, RSI(14) 70, above its 50-day and above its 200-day average.

Intraday chart of IDXX on 2026-11-16
Session (intraday)
Three-month daily chart of IDXX
Three months (daily)
Revenue (latest FY)
$4.30B
Net income (latest FY)
$1.06B
Cash
$197.5M

Prices: Alpaca IEX feed · Financials: SEC EDGAR XBRL · Primary source: Idexx Laboratories Inc filings on SEC EDGAR
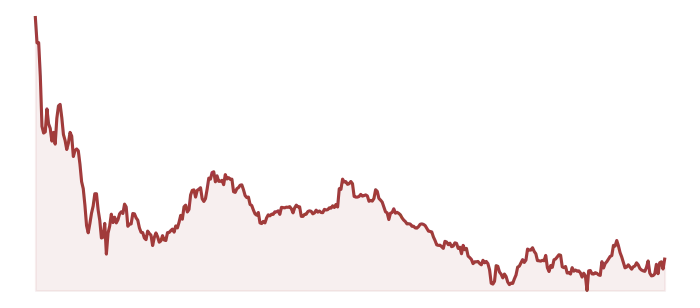
Bottom of the screen

ALNY

Alnylam Pharmaceuticals Inc

159.79−3.2%
HealthcareBiotechnology
3 months−34.1%
52-week range52w low3%high
RSI (14)32
Session
below VWAP 160.680.95× avg vol
Moving averages
below 50dbelow 200d
View ALNY chart on TradingView Affiliate
Case study: why ALNY is on this page

Bottom of this screen: profitable last fiscal year; revenue +65.2% YoY; below its 200-day average; near its 52-week low; -34.1% over 3 months.

Close 159.79: −3.2% vs previous closeSession (open→close): −4.4%

Session: day range 158.75–167.54, VWAP 160.68 (below VWAP), IEX volume 0.95× its 20-day average. Trend: −34.1% over three months, 3% of the way up its 52-week range, RSI(14) 32, below its 50-day and below its 200-day average.

Intraday chart of ALNY on 2026-11-16
Session (intraday)
Three-month daily chart of ALNY
Three months (daily)
Revenue (latest FY)
$3.71B
Net income (latest FY)
$313.7M
Cash
$1.75B

Prices: Alpaca IEX feed · Financials: SEC EDGAR XBRL · Primary source: Alnylam Pharmaceuticals Inc filings on SEC EDGAR
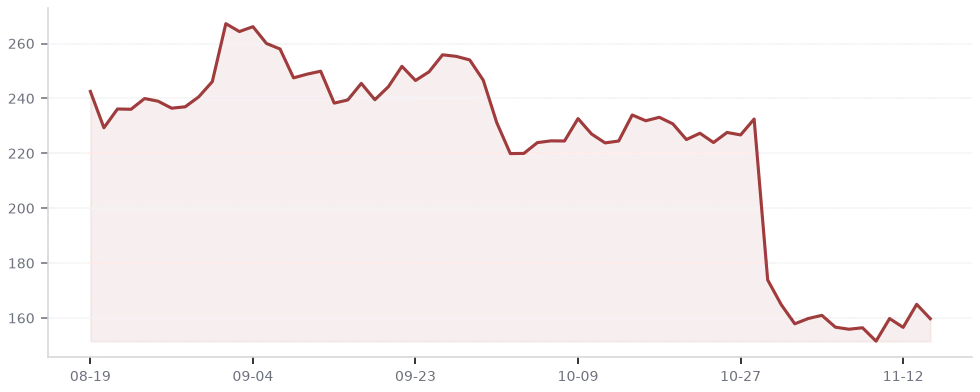
NVDA

NVIDIA Corp

156.15−4.1%
TechnologySemiconductors
3 months−28.2%
52-week range52w low8%high
RSI (14)23
Session
below VWAP 158.071.49× avg vol
Moving averages
below 50dbelow 200d
View NVDA chart on TradingView Affiliate
Case study: why NVDA is on this page

Bottom of this screen: profitable last fiscal year; revenue +65.5% YoY; below its 200-day average; near its 52-week low; -28.2% over 3 months.

Close 156.15: −4.1% vs previous closeSession (open→close): −1.8%

Session: day range 155.02–162.53, VWAP 158.07 (below VWAP), IEX volume 1.49× its 20-day average. Trend: −28.2% over three months, 8% of the way up its 52-week range, RSI(14) 23, below its 50-day and below its 200-day average.

Intraday chart of NVDA on 2026-11-16
Session (intraday)
Three-month daily chart of NVDA
Three months (daily)
Revenue (latest FY)
$215.94B
Net income (latest FY)
$120.07B
Cash
$22.44B

Prices: Alpaca IEX feed · Financials: SEC EDGAR XBRL · Primary source: NVIDIA Corp filings on SEC EDGAR
The charts use the candlestick, VWAP and moving-average reading taught in our free courses. To pull up any of these tickers yourself, TradingView’s free plan covers it. Affiliate link: we may earn a commission if you subscribe, at no extra cost to you.

Reminder: nothing on this page is investment advice. These names appear because of where they landed in the screen, not because of any view on where the price goes next. Past performance does not indicate future results. See the Disclaimer.