
Classic Chart Patterns: Flags, Triangles, and Reversal Shapes
Beyond single candles and simple support/resistance lines, certain multi-day price shapes repeat often enough across every liquid market that traders gave them names decades ago. None of them work because of some hidden mathematical law — they work (when they work at all) for the same reason the 200-period moving average matters: enough market participants recognize the same shape and react to it the same way, which makes the pattern partly self-fulfilling. That also means every pattern on this page fails a meaningful fraction of the time, and should always be read alongside volume and the broader trend, never in isolation.
Head and Shoulders (Reversal)
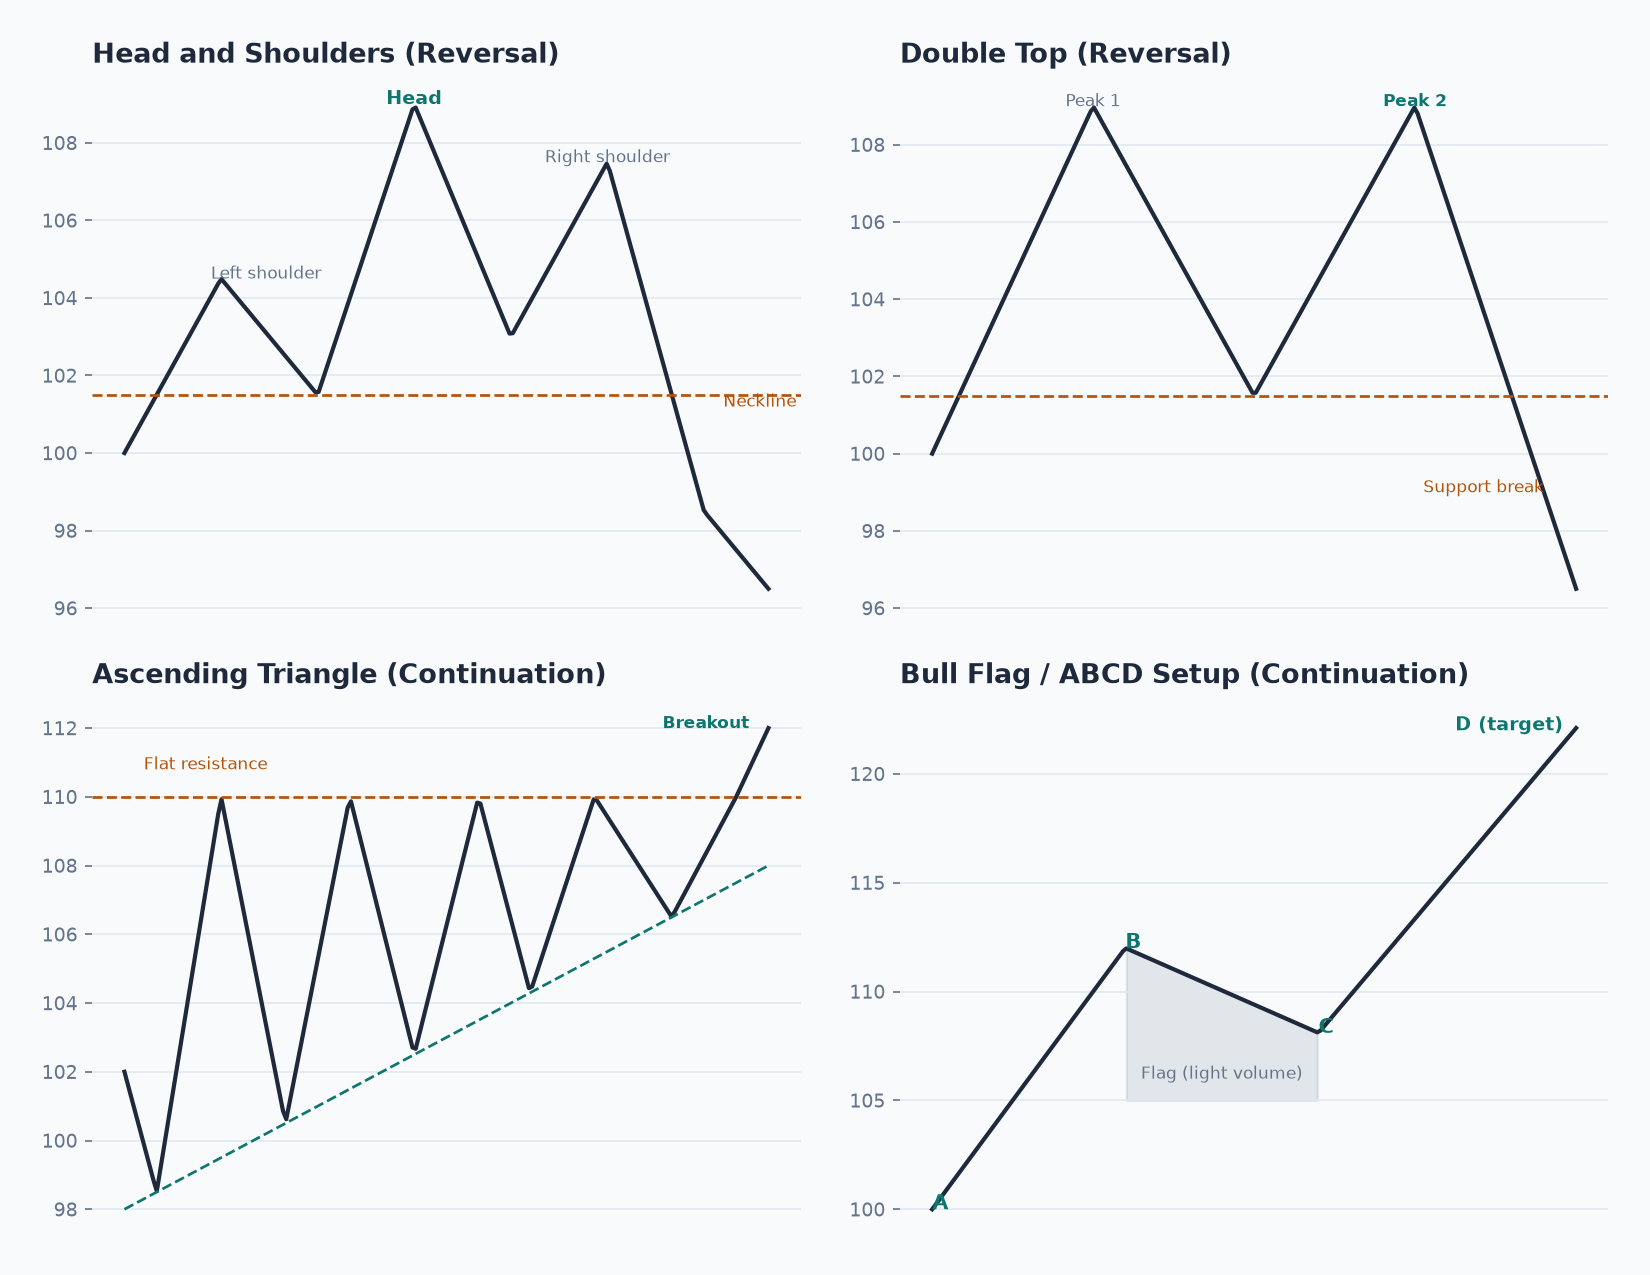
A head-and-shoulders top forms after an uptrend: price makes a peak (the left shoulder), pulls back, makes a higher peak (the head), pulls back again, then makes a third peak roughly even with the first (the right shoulder) before breaking down through the “neckline” — the line connecting the two pullback lows. It is read as a reversal signal: three attempts to make a new high, with the middle attempt the only one that succeeds, often marks real buying exhaustion. The inverse shape (inverse head and shoulders) is the same logic at a bottom, signaling a possible reversal from down to up.
Double Top and Double Bottom (Reversal)
A double top is simpler: two peaks at roughly the same price, with a pullback between them, followed by a break below that pullback low. The failure to clear the prior high on the second attempt is read as a sign the uptrend has lost the force to make new highs. A double bottom is the mirror image at the lows — two roughly equal lows with a bounce between them, followed by a break above that bounce high.
Triangles (Continuation)
A triangle forms when price compresses between two converging trendlines — lower highs and higher lows squeezing toward a point. An ascending triangle (flat resistance on top, rising support underneath) is read as bullish, since buyers are willing to pay more each time while sellers defend the same ceiling — a ceiling that eventually gets tested with more force each attempt. A descending triangle is the bearish mirror. A symmetrical triangle (both lines converging toward each other) is directionally neutral on its own — it signals compression and an impending move, but not which way, until price actually breaks one side.
Bull Flags and the ABCD Setup (Continuation)
A bull flag is a short, shallow, downward-sloping pullback (the “flag”) after a sharp upward move (the “pole”), on noticeably lighter volume than the pole itself. The light volume on the pullback is the key tell: it suggests profit-taking, not a genuine change of mind among buyers. A break back above the flag’s upper boundary, ideally on volume picking back up, is read as a continuation of the original move. The ABCD setup describes the same underlying idea more generally as four labeled points: A (the start of the first move), B (the high of that move), C (the pullback low), and D (the projected continuation target) — it is a framework for mapping and measuring a continuation move, not a different pattern from the bull flag so much as a more precise way to label one.
Patterns Are Probabilities, Not Guarantees
Every shape on this page can and does fail — a head-and-shoulders neckline breaks and price promptly reverses back up, a bull flag’s flag breaks down instead of up. None of these patterns should be read as a signal on their own; they are one more layer of context to weigh alongside the trend, the moving averages, and the volume covered earlier in this course, the same discipline described in the Technical Analysis Checklist that closes out this course.