
Building a Technical Analysis Checklist
This closing lesson doesn’t introduce new material — it’s a synthesis of everything covered across this course, organized into a practical sequence for reading any chart, on any timeframe, before forming a view on it.
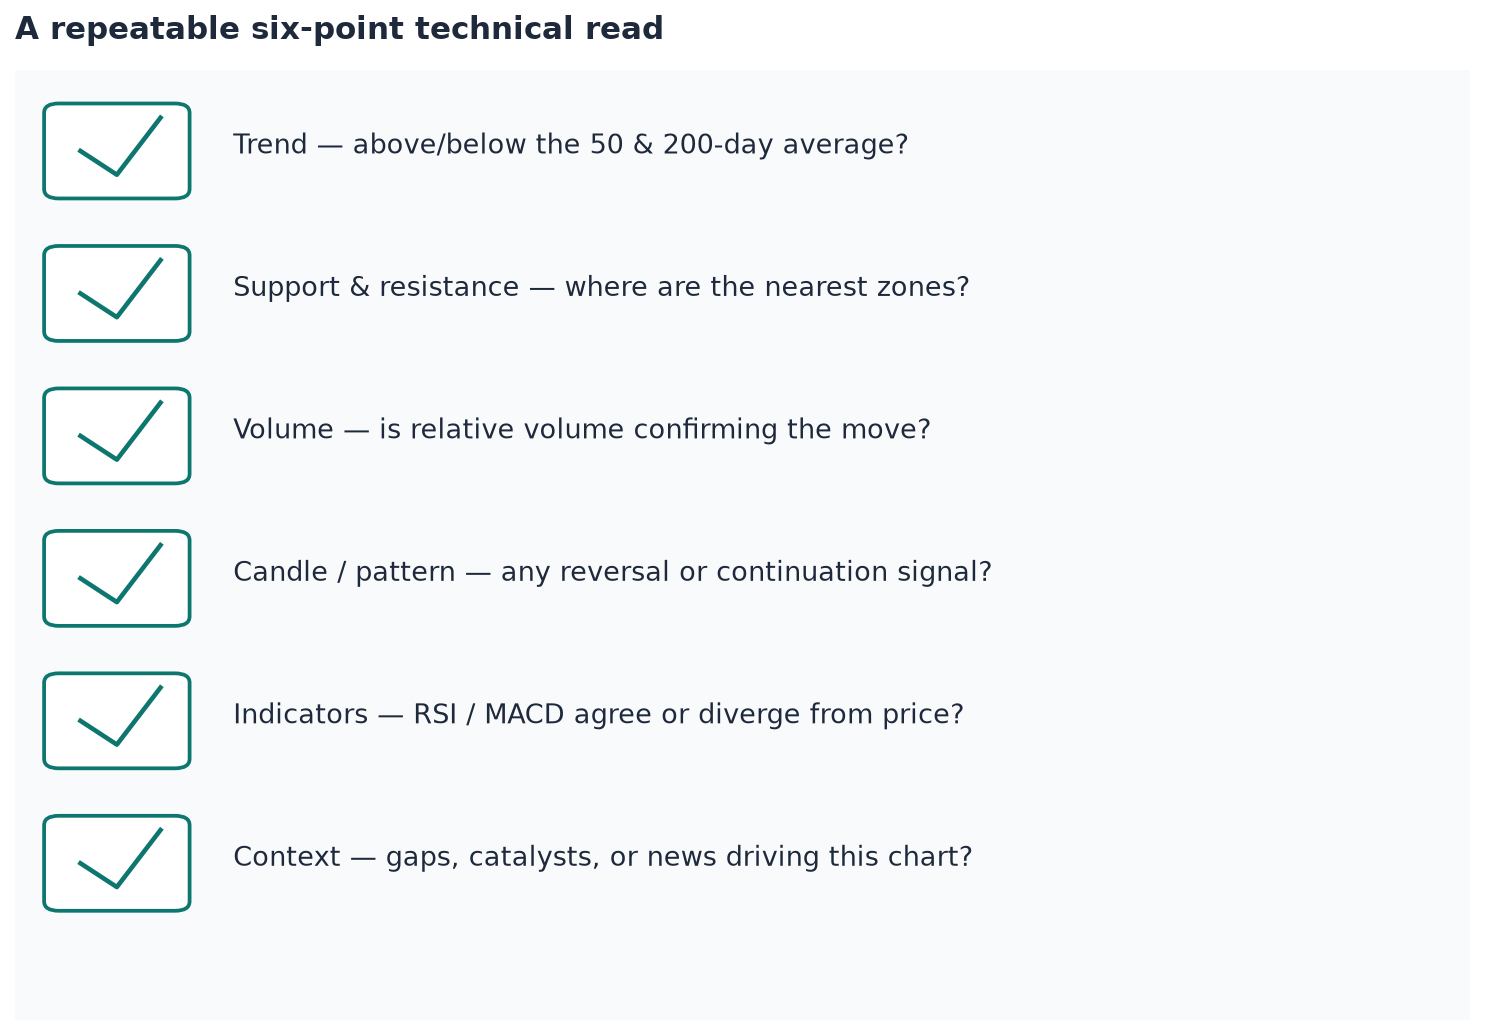
A Repeatable Sequence
- Identify the chart type and timeframe. Confirm you’re looking at a candlestick chart (not a line chart hiding the real range) on a timeframe appropriate to the question being asked — daily for overall context, 5-minute or 1-minute for intraday precision.
- Read right to left for recent structure. What has price done in the last several candles? Is there a clear directional trend, or is price range-bound and directionless?
- Map support and resistance. Identify the nearest levels above and below current price, on both the timeframe in question and the daily chart for broader context. Note whether any of those levels are round numbers, which tend to carry extra weight.
- Check for gaps and windows. Is there open territory ahead with no built-up resistance, or is the stock approaching a level with a meaningful amount of trapped supply behind it?
- Look for a recognizable pattern. Does the recent price action resemble a bull flag, an ABCD setup, a double top or bottom, or does it show signs of a dead-cat-bounce dynamic rather than a genuine trend change?
- Confirm with indicators, don’t lead with them. Where does price sit relative to key moving averages and VWAP? Is volume confirming the move, or is price advancing on unusually light participation?
- Assess the daily chart’s overall quality. Pull back to the daily view and ask whether this is, on balance, a strong chart (room to run, no nearby resistance, a history of big moves) or a weak one (capped by stacked resistance, no history of large moves, limited room before the next ceiling).
Why Sequence Matters
Reading these steps in this order isn’t incidental. Context (chart type, timeframe, recent structure) should always come before attaching meaning to a specific pattern or indicator reading, because the exact same candle shape or indicator signal carries different weight depending on everything around it. Indicators are listed last on purpose: they’re confirmation tools, meant to support a read already formed from price structure, not a starting point for forming that read.
Where Technical Analysis Fits
Technical analysis describes what a chart has shown and what patterns in price and volume have tended to precede, not a crystal ball. It pairs naturally with the type of fundamental and catalyst-driven context covered in Company Analysis, and with the risk-management and discipline framework covered in Trading Methodology — each piece adds a different layer of context to the same underlying question: is this a situation worth paying attention to, and if so, on what terms.